In this tutorial, you will learn when and why we may want or need to standardize data in R. We will also discuss what it means to standardize variables and which R functions we can use. Moreover, the tutorial will then provide a step-by-step guide on standardizing data in R, starting with standardizing a vector, moving on to standardizing a matrix, standardizing data in a dataframe, and finally, standardizing only numeric columns in a dataframe. The go-to function in R to standardize data is the scale() function:
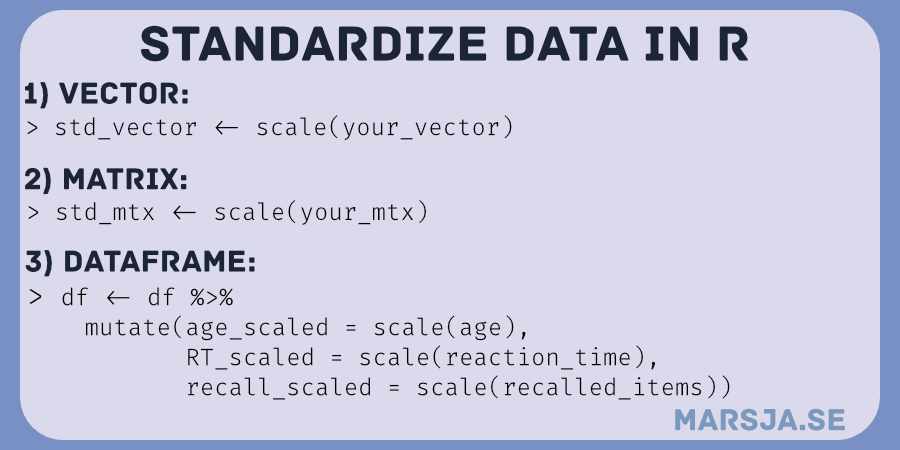
Table of Contents
- Outline
- Requirements
- When we May Want to or Need to Standardize Data in R:
- How to Standardize Data in R
- Conclusion: Standardize data in R
- Resources
In statistics and data science, standardization is a common data preprocessing technique. Standardization is when we transform data with a mean of 0 and a standard deviation of 1. Data standardization can be beneficial in various situations, particularly in psychological research. For example, in Psychology, different measurement scales can measure the same construct. For instance, before confirmatory factor analysis (CFA) or structural equation modeling (SEM), we may need to standardize data to ensure the results are meaningful and interpretable.
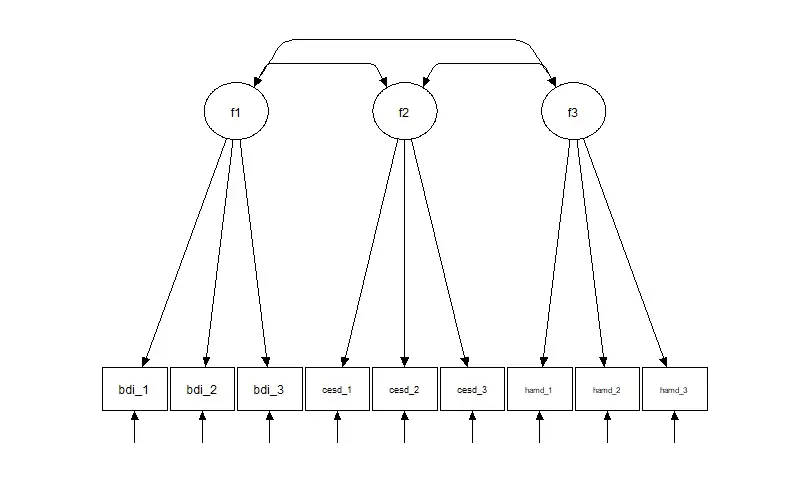
For example, let us say we have measured the construct of depression using three different measures. We use the Beck Depression Inventory (BDI), the Center for Epidemiologic Studies Depression Scale (CES-D), and the Hamilton Rating Scale for Depression (HAM-D). Each measure may, in this case, have a different scale and scoring system, making comparing and analyzing the results difficult.
To overcome this issue, we can standardize the data by transforming each measure into a z-score. A z-score represents the number of standard deviations an observation is from the mean. Moreover, it allows us to compare and combine data from different scales. For calculation of the z-score see the more recent post:
Outline
The outline of the post is as follows. First, before learning how to standardize data in R, we will cover the requirements to follow this post. Next, we will briefly look into when and why we may want or need to standardize our data, shedding light on its significance and applications.
Following this, we will explore the practical aspects of standardizing data in R. We will learn various techniques for standardization, catering to different data structures and scenarios. The journey begins with understanding how to standardize a vector in R, an essential building block. We will then move on to more complex data structures, including matrices, as we learn how to standardize them in R.
Standardization does not stop at individual data structures; it plays a pivotal role in data analysis involving dataframes in R. Therefore, we will explore the steps required to standardize data within a data frame, ensuring our dataset is prepared for meaningful analysis.
Moreover, we will address scenarios where standardizing numeric columns only within a data frame is more appropriate. This in-depth insight into standardization techniques will give you the knowledge and skills to make informed decisions in your data analysis projects.
Requirements
To standardize data in R, you need a basic understanding of the syntax and data structures of the R programming environment. Of course, you also need some knowledge of the concept of standardization itself. Here are the requirements to standardize data in R:
- R syntax: You need a basic understanding of R syntax, including how to load data into R, create variables, and manipulate data using functions and packages.
- Data structures: Standardization can be applied to different data structures, including vectors, matrices, and data frames. Therefore, you should understand these data structures and how to manipulate them using R functions.
- Standardization concept: Standardization is a statistical technique transforming data with a mean of 0 and a standard deviation of 1. This technique is used to compare variables that are measured on different scales or have different units of measurement. Therefore, you should have a basic understanding of standardization and when to use it appropriately.
- R-packages: Several R packages can be used to standardize data, including
base,dplyr, andtidyverse. Thebasepackage provides built-in functions for calculating the mean and standard deviation of data, while thedplyrandtidyversepackages provide functions for manipulating data frames and columns.
Note that the dplyr package is convenient when you, e.g., need to rename columns in R, count the number of cccurrences in a column, among other things.
When we May Want to or Need to Standardize Data in R:
As previously mentioned, data standardization is a common data preprocessing step in many quantitative research fields, including psychology. Here are two scenarios in which we may need to standardize data:
- Comparing variables measured on different scales: In psychological research, measuring different variables on different scales is common. For example, we might measure anxiety on a Likert scale from 1 to 5, while we measured income in Swedish kronor. We cannot compare these variables directly. However, standardization can put them on the same scale, allowing for comparisons.
- Comparing performance in different cognitive tests: In cognitive psychology, researchers often measure various aspects of cognition using different tasks, such as working memory (WM) tasks, attention tasks, and reaction time tasks. These tasks may have different scales or units of measurement, making it challenging to compare performance across tasks. In this case, we can use standardization to get the scores from each task on the same scale, allowing for meaningful comparisons across tasks. For example, suppose we want to compare performance on two WM tasks. The first task measures the number of correct recalled items, and the second uses reaction time. In that case, we can standardize the number of correct recalled items and reaction times separately and then compare the standardized scores. This would ensure that any differences in performance are due to differences in cognitive abilities rather than differences in task difficulty or other factors.
Standardizing variables in R means transforming the original data with a mean of 0 and a standard deviation of 1. To standardize data is also called “z-score normalization” or “standardization to unit variance”.
In R, you can use several functions and packages for standardizing data. One of these functions is the scale() function. The scale() function standardizes a vector or matrix by subtracting the mean and dividing by the standard deviation. Other options are the preProcess() function from the caret package and the standardize() function from the psych package.
There are many methods to standardize data in R. For example, you can use the scale() function on a vector: scale(YourVector). This post will cover multiple standardization methods, including working with vectors, matrices, and columns in dataframes.
How to Standardize Data in R
Here are some examples of how to standardize data in R:
1. Standardize a Vector in R
Here is an example of how to use R to standardize a vector containing reaction times:
# Vector with reaction times (msec)
rt_ms <- c(400, 300, 500, 350, 450)
# Standardize the reaction time
rt_std <- scale(rt_ms)
# View the standardized reaction times
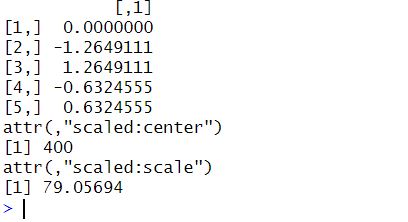
rt_std
Code language: R (r)In the code chunk above, we created a vector rt_ms containing reaction times (in milliseconds). Next, we use the scale() function to standardize the reaction times in the vector. The scale() function subtracts the mean of the vector and divides it by the standard deviation, resulting in a vector with a mean of 0 and a standard deviation of 1. Finally, we view the reaction times we standardized in R by printing the rt_std vector. Here is the result:
2. Standardize Matrix in R
Here is an example of standardizing data in R when stored in a matrix. In the code chunk below, we first create an R matrix. Next, we use the scale() function to standardize each column of the matrix.
# Create a matrix of working memory data
wm_data <- matrix(c(8, 400, 7, 450, 6, 500, 9, 350, 5, 550), nrow = 5, ncol = 2,
byrow = TRUE)
# Define variable names for the matrix
colnames(wm_data) <- c("Recall", "RT")
# Standardize the data
wm_data_std <- scale(wm_data)
# View the standardized data
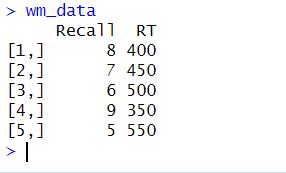
wm_data_stdCode language: R (r)In the code chunk above, we create a matrix (wm_data) containing the working memory data. The data is from two tasks: one using the number of correct recalled items and the other using the reaction time.
The matrix() function is used to create the matrix. We then use the c() function to concatenate the data elements into a vector, which is then used to fill the matrix. Moreover, data in the matrix are entered row by row because of the argument byrow = TRUE. The nrow and ncol arguments specify the number of rows and columns in the matrix. In this case, the matrix has five rows and two columns. We then define variable names for the matrix using colnames(). Here is the matrix that we created:
Next, the scale() function is used to standardize the data. This function centers the data by subtracting the mean from each column and then scales it by dividing it by the standard deviation. The resulting wm_data_std matrix contains standardized values for both columns. Here is the result:
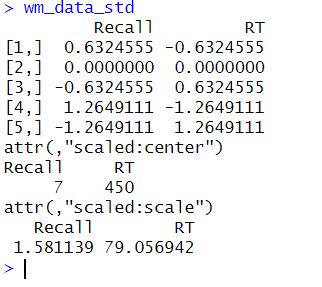
In this case, standardizing enables us to compare the two working memory tasks equally, even though they were measured on different scales. After we have standardized our data and conducted our regression analysis, we may want to run some model diagnostics. Here are some tutorials focusing on diagnostics:
3. Standardize data in R in a dataframe
In this example, we are going to use dplyr and the select()function to standardize data stored in R’s dataframe object:
# Load necessary packages
library(dplyr)
# Generate example data frame
df <- data.frame(
id = 1:5,
age = c(24, 35, 29, 31, 26),
reaction_time = c(400, 450, 500, 350, 550),
recalled_items = c(8, 7, 6, 9, 5)
)
# Standardize columns using dplyr and select()
df_std <- df %>%
select(-id) %>%
scale() %>%
as.data.frame() %>%
cbind(id = df$id)
# Viewstandardized data frames
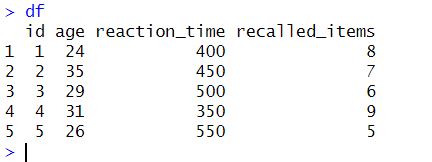
df_stdCode language: R (r)In the code chunk above, we first load the dplyr package. We then generate a data frame df containing five observations of four variables: id, age, reaction_time, and recalled_items. Here is the resulting dataframe:
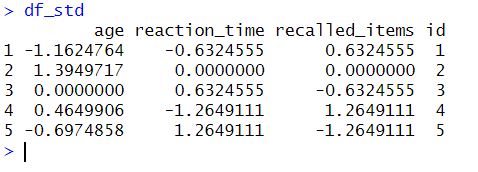
Next, we use dplyr and select() to select all columns except for id, which we don’t want to standardize. Notice that after df we use the %>% operator to pipe it into the following line of code (the same is true wherever you see the piping operator). We then apply the scale() function to standardize the selected columns. Moreover, we convert the resulting matrix to a data frame using as.data.frame(). Finally, we use cbind() to add the id column back into the standardized data frame. Here is the result:
We can also add a column to the dataframe in R with the add_column() function. Obviously, and in most cases, we do not create data frames manually as we did in the previous example. Instead, we typically load data from a file, such as a .csv file. Additionally, we can use the mutate() function:
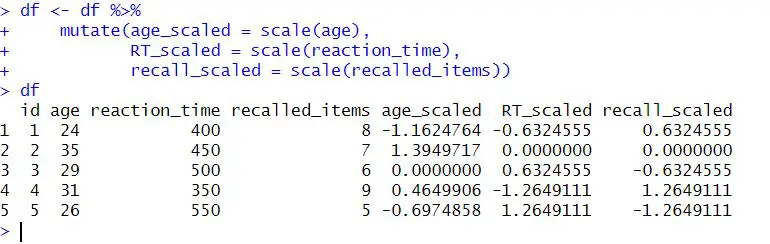
df <- df %>%
    mutate(age_scaled = scale(age),
           RT_scaled = scale(reaction_time),
           recall_scaled = scale(recalled_items))Code language: R (r)
In the code chunk above, we used the %>% operator, which passes the df dataframe into the mutate() function. Moreover, the mutate() function is used to create new columns in the dataframe. Notably, the scale() function standardizes the data in each column to have a mean of 0 and a standard deviation of 1. The standardized values are then assigned to new columns: age_scaled, RT_scaled, and recall_scaled. Here are two posts about two great operators:
- How to use %in% in R: 7 Example Uses of the Operator
- How to use $ in R: 6 Examples – list & dataframe (dollar sign operator)
Check out some posts related to data analysis in R:
4. Standardizing Numeric Columns Only in R’s dataframe
Here, we are going to learn how to use mutate_if to standardize data in R that is numeric only:
# Load the needed libraries
library(dplyr)

# create example data frame
df <- data.frame(id = 1:10,
                 group = rep(c("treatment", "control"), each = 5),
                 bdi = sample(0:63, 10, replace = TRUE),
                 cesd = sample(0:60, 10, replace = TRUE),
                 hamd = sample(0:52, 10, replace = TRUE))

# Scale numeric
df_std <- df %>%
  select(-id) %>%
  mutate_if(is.numeric, scale) %>%
  cbind(id = df$id)Code language: PHP (php)
In the code chunk above, we first create a matrix. However, the important code is found in line twelve. Here we remove a column in the R dataframe (i.e., the id column). Note how we used select(-id) to remove the column. Next, we use mutate_if() to apply the scale() function to all numeric columns in the dataframe. Finally, the id column is added back to the dataframe using cbind(). This ensures that the id column is not included in the standardization process. This method is handy when we have many variables that we want standardized. Here are some other potentially useful posts.
- How to Calculate Five-Number Summary Statistics in R
- How to Take Absolute Value in R – vector, matrix, & data frame
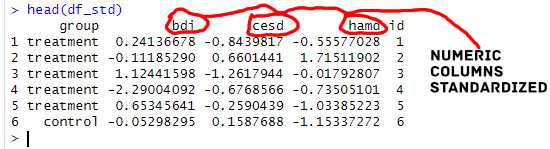
Here are the first few rows of the dataframe with the standardized variables:
Conclusion: Standardize data in R
In conclusion, in this post, we have learned the importance of standardizing data in R and the possible methods we can use. Standardization is an important step in data analysis, as it helps to ensure that all variables are on the same scale, making it easier to compare and interpret the results.
First, we learned some situations where we may want or need to standardize data. Here, we used examples from psychological research. We then explained what it means to standardize variables in R and the function used for standardization.
In the next section, we demonstrated how to standardize 1) a vector in R using the scale() function and 2) how to standardize a matrix, and 3) the standardization of a dataframe. In addition, we looked at how to standardize only numeric columns in a dataframe using the dplyr package and the mutate_if function. If you have standardized your data and fitted your model (e.g., a regression), you can plot the prediction interval in R using ggplot2.
Generally, standardizing data in R is a simple and essential process in data analysis that helps to ensure that variables are on the same scale, making it easier to compare and interpret the results.
Finally, it is essential to understand the nature of the data and the research question before deciding whether to standardize variables. Standardization may sometimes be unnecessary or inappropriate, and other transformations may be more suitable. However, standardizing variables can be essential to ensure that data analysis is accurate and reliable.
Resources
Here are some resources that you may find useful:
- Durbin Watson Test in R: Step-by-Step incl. Interpretation
- Sum Across Columns in R – dplyr & base
- Z Test in R: A Tutorial on One Sample & Two Sample Z Tests
- Binning in R: Create Bins of Continuous Variables
- Coefficient of Variation in R