In this blog post, we will learn how to sum across columns in R. Summing over columns can be a useful data analysis technique in various fields, including data science, psychology, and hearing science. The post will show several examples of how to sum across columns in R, including summing across a matrix, multiple columns in a dataframe, and all columns or specific columns in a dataframe. We will use base R functions and some of the tidyverse packages. Whether you are new to R or an experienced user, the examples in this blog post will hopefully help you better understand how to summarize and analyze your data in R.
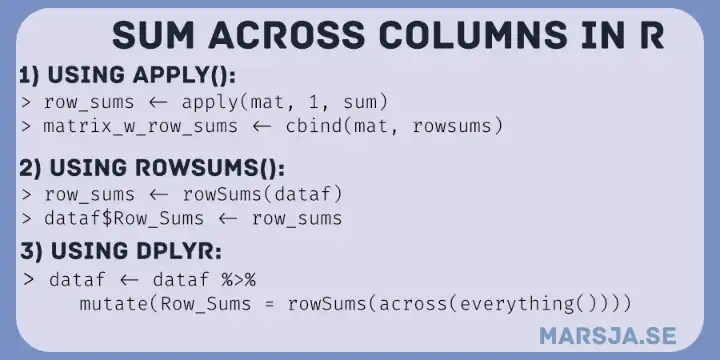
Table of Contents
- Requirements
- Sum Across Columns Examples
- Sum Across Columns in Matrix in R
- Sum Across Multiple Columns in an R dataframe
- Sum Over Columns using %in% in R
- Sum Across All Columns in R using dplyr
- Sum Across All Numeric Columns in R
- How to Sum Across Specific Columns
- Sum Over Specific Columns with dplyr
- Frequently Asked Questions
- Summary
- More Tutorials:
Requirements
To follow this blog post, you should have a basic understanding of R and dataframes. Familiarity with the Tidyverse packages, including dplyr, will also be helpful for some of the examples. However, the post will provide explanations and code examples to guide readers through each step of the process. No prior knowledge of summing across columns in R is required.
Check out the recent post about converting multiple columns to numeric in R if you need to change data types in your dataframe before summing across columns.
Sum Across Columns Examples
Summarizing across columns in data analysis is common in various fields, such as data science, psychology, and hearing science. It involves calculating the sum of values across two or more columns in a dataset. This section will discuss examples of when we might want to sum across columns in data analysis for each field.
Data Science
Financial Analysis
Summing across columns is a common calculation technique used in financial analysis for financial metrics. For example, we might want to calculate a company’s total revenue over time. In this case, we would sum the revenue generated in each period. Another example is calculating the total expenses incurred by a company. In this case, we would sum the expenses incurred in each period.
Survey Analysis
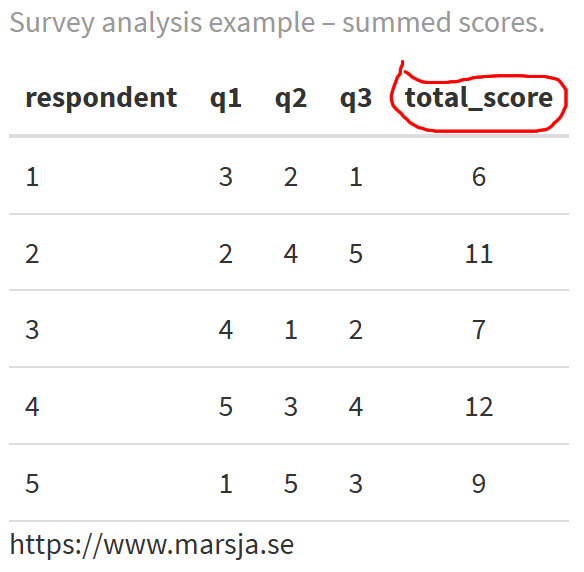
In survey analysis, we might want to calculate the total score of a respondent on a questionnaire. The questionnaire may contain multiple questions, and each question may be assigned a score. In this case, we would sum the scores assigned to each question to calculate the respondent’s total score.
Psychology
Psychometric Testing
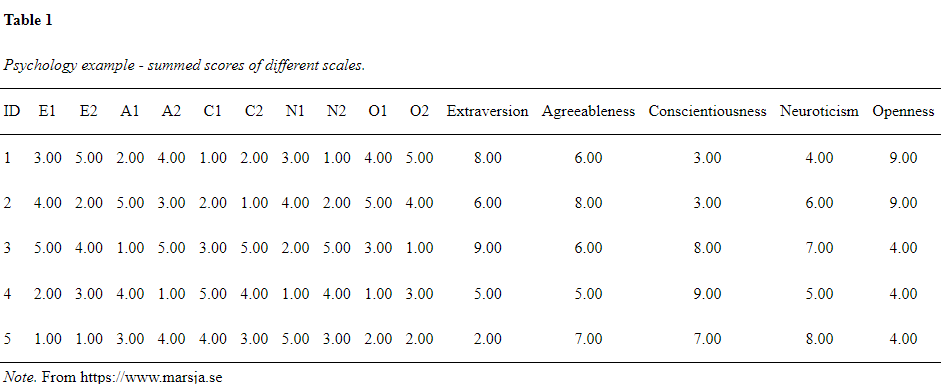
In psychometric testing, we might want to calculate a total score for a test that measures a particular psychological construct. For example, the Big Five personality traits test measures five traits: extraversion, agreeableness, conscientiousness, neuroticism, and openness. Each trait might have multiple questions, and each question might be assigned a score. In this case, we would sum the scores assigned to each question for each trait to calculate the total score for each trait. Here is an example table in which the columns E1 and E2 are summed as the new columns Extraversion (and so on):
Behavioral Analysis
In behavioral analysis, we might want to calculate the total number of times a particular behavior occurs. For example, we might want to calculate the total number of times a child engages in aggressive behavior in a classroom setting. We might record each instance of aggressive behavior and then sum the instances to calculate the total number of aggressive behaviors.
Hearing Science
Audiological Testing
In audiological testing, we might want to calculate the total score for a hearing test. The test may involve multiple frequencies, and each frequency may be assigned a score based on the individual’s ability to hear it. In this case, we would sum the scores assigned to each frequency to calculate the total score for the hearing test.
Speech Analysis
In speech analysis, we might want to calculate the number of phonemes an individual produces. Phonemes are the basic sound units in a language, and different languages have different sets of phonemes. In this case, we would transcribe the individual’s speech and then count the number of phonemes produced to calculate the total number of phonemes.
Sum Across Columns in Matrix in R
To sum across columns using base R, you can use the apply() function with margin = 1, which tells R to apply the function across rows. Here is a simple example:
# Create a sample matrix
mat <- matrix(c(1, 2, 3, 4, 5, 6), nrow = 2)

# View the matrix
mat
#>      [,1] [,2] [,3]
#> [1,]    1    3    5
#> [2,]    2    4    6

# Sum the values across rows
row_sums <- apply(mat, 1, sum)

# View the row sums
row_sumsCode language: R (r)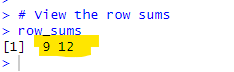
In the code chunk above, we first create a 2 x 3 matrix in R using the matrix() function. We then use the apply() function to sum the values across rows by specifying margin = 1. Finally, we use the sum() function to apply to each row. The resulting row_sums vector shows the sum of values for each matrix row.
Add the Summed Columns to the Matrix
You can use the function to bind the vector to the matrix to add a new column with the row sums to the matrix using base R. Here is how we add it to our matrix:
# Add a new column to the matrix with the row sums
mat_with_row_sums <- cbind(mat, row_sums)

# Print the matrix with the row sums
mat_with_row_sumsCode language: PHP (php)
In the code chunk above, we used the cbind() function to combine the original mat matrix with the row_sums vector, where mat was listed first and row_sums was listed second. This resulted in a new matrix called mat_with_row_sums that had the same number of rows as mat, but one additional column on the right-hand side with the row sums.
More about adding columns in R:
- R: Add a Column to Dataframe Based on Other Columns with dplyr
- How to Add an Empty Column to a Dataframe in R (with tibble)
Sum Across Multiple Columns in an R dataframe
To sum across multiple columns in R in a dataframe we can use the rowSums() function. Here is an example:
# Create a list of variables
data_list <- list(var1 = c(1, 2, 3), var2 = c(4, 5, 6), var3 = c(7, 8, 9))

# Convert the list to a dataframe
df <- data.frame(data_list)

# Sum the values across columns for each row
row_sums <- rowSums(df)

# Add a new column to the dataframe with the row sums
df$Row_Sums <- row_sumsCode language: R (r)
In the code chunk above, we first created a list called data_list with three variables var1, var2, and var3, each containing a numeric vector of length 3.
We then use the data.frame() function to convert the list to a dataframe in R called df. This function automatically uses the names of the variables in the list as column names for the dataframe.
Next, we use the rowSums() function to sum the values across columns in R for each row of the dataframe, returning a vector of row sums.
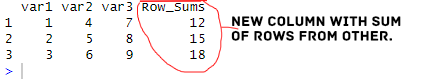
We then add a new column called Row_Sums to the original dataframe df, using the assignment operator <- and the $ operator in R to specify the new column name. We set the new column’s values to the vector we calculated earlier.
Finally, we view the modified dataframe df with the added column using the print() function (implicit in the R console). The resulting df dataframe has the same dimensions as the original dataframe, with a new fourth column containing the row sums. Now that you have summed across your columns, you might want to standardize your data in R.
Sum Over Columns using %in% in R
We can use the %in% operator in R to identify the columns that we want to sum over:
df <- data.frame(x1 = 1:3, x2 = 4:6, x3 = 7:9, y1 = 10:12, y2 = 13:15, y3 = 16:18)

cols_to_sum <- names(df) %in% c("y1", "y2", "y3")
row_sums <- rowSums(df[, cols_to_sum])
Code language: R (r)
In the code chunk above, we first use the names() function to get the names of all the columns in the data frame df. The values in the columns were created as sequences of numbers with the : operator in R. We then used the %in% operator to create a logical vector cols_to_sum that is TRUE for columns that contain the string “y” and FALSE for all other columns.
Finally, we use the rowSums() function to sum the values in the columns specified by cols_to_sum. The resulting vector row_sums contains the sum of the values in columns y1, y2, and y3 for each row in the data frame df.
Using %in% can be a convenient way to identify columns that meet specific criteria, especially when you have a large data frame with many columns.
Sum Across All Columns in R using dplyr
We can use the dplyr package from the Tidyverse to sum across all columns in R. Here is an example:
library(dplyr)

# Create a dataframe
df <- data.frame(
  var1 = c(1, 2, 3),
  var2 = c(4, 5, 6),
  var3 = c(7, 8, 9)
)

# Sum the values across all columns for each row
df <- df %>%
  mutate(Row_Sums = rowSums(across(everything())))Code language: R (r)
In the code chunk above, we first use the %>% operator to pipe the dataframe df into a mutate() function call. This allows us to create a new column called Row_Sums.
We used the across() function to select all columns in the dataframe (i.e., everything()) to be passed to the rowSums() function, which sums the values across all columns for each row.
Finally, the resulting row_sums vector is then added to the dataframe df as a new column called Row_Sums.
Sum Across All Numeric Columns in R
Here is an example of how to sum across all numeric columns in a dataframe in R:
library(dplyr)
# Create a dataframe
df <- data.frame(
var1 = c(1, 2, 3),
var2 = c("a", "b", "c"),
var3 = c(4, 5, 6),
var4 = c("d", "e", "f"),
var5 = c(7, 8, 9)
)
# Sum the values across all numeric columns for each row using across()
df <- df %>%
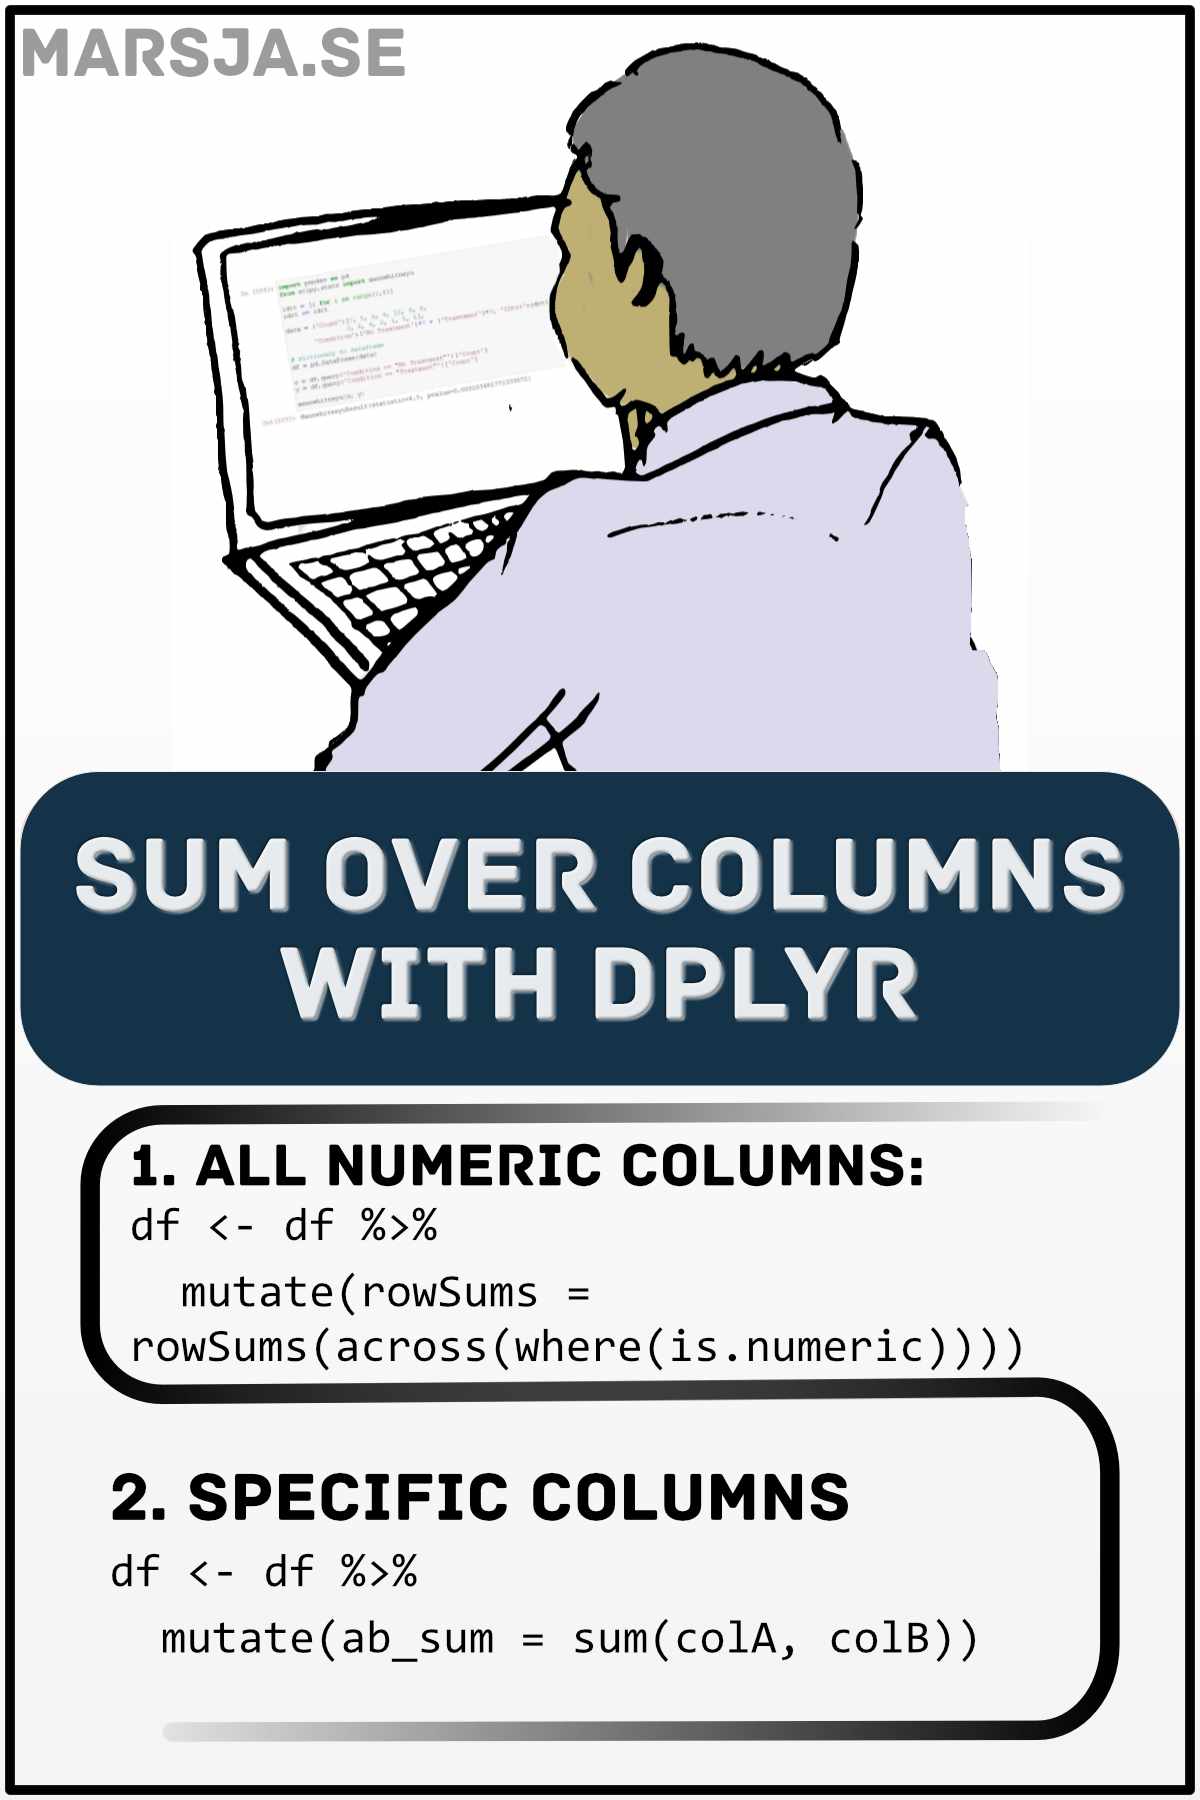
mutate(rowSums = rowSums(across(where(is.numeric))))Code language: R (r)First, we take the dataframe df and pass it to the mutate() function from the dplyr package.
Within mutate(), we use the across() function to select all columns in the dataframe where the data type is numeric using where(is.numeric).
Then, we apply the rowSums() function to the selected columns, which calculates the sum of each row across those columns. Finally, we create a new column in the dataframe rowSums to store the resulting vector of row sums.
The resulting dataframe df will have the original columns as well as the newly added column rowSums, which contains the row sums of all numeric columns.
How to Sum Across Specific Columns
To sum across Specific Columns in R, we can use dplyr and mutate():
library(dplyr)

# Create a sample dataframe
df <- data.frame(id = 1:5,
                 a = c(3, 4, 5, 6, 7),
                 b = c(2, 2, 2, 2, 2),
                 c = c(1, 2, 3, 4, 5))

# Sum columns 'a' and 'b' using the sum() function and create a new column 'ab_sum'
df <- df %>%
  mutate(ab_sum = sum(a, b))Code language: R (r)
In the code chunk above, we create a new column called ab_sum using the mutate() function. Instead of using the + operator, we use the sum() function to add the values in columns a and b. The sum() function takes any number of arguments and returns the sum of those values.
The resulting dataframe df will have the original columns as well as the newly added column ab_sum, which contains the sum of columns a and b.
Sum Over Specific Columns with dplyr
We can use the select() function from the dplyr package to select the columns we want to sum across and then use the rowSums() function to sum across those columns. Here is an example:
library(dplyr)

# Create a sample data frame
df <- data.frame(
  id = 1:5,
  x1 = c(1, 2, 3, 4, 5),
  x2 = c(2, 4, 6, 8, 10),
  y1 = c(3, 6, 9, 12, 15),
  y2 = c(4, 8, 12, 16, 20)
)

# Select columns x1 and x2 using select() and sum across rows using rowSums()
df <- df %>%
  mutate(row_sum = rowSums(select(., c(x1, x2))))

# View the resulting data frame
dfCode language: PHP (php)
In the code chunk above, we first load the dplyr package and create a sample data frame with columns id, x1, x2, y1, and y2. We then use the mutate() function from dplyr to create a new column called row_sum, where we sum across the columns x1 and x2 for each row using rowSums() and the select() function to select those columns in R.
Frequently Asked Questions
Yes, you can sum columns in R using various functions and methods. Your chosen method depends on whether you work with data frames, matrices, or vectors.
You can sum all columns in R using the colSums() function on a data frame or matrix. For example, running this code: total_sum <- colSums(data) will summ all columns in the dataframe named data.
To sum the values of two columns in R, you can use the + operator to add the columns together.
Summary
In this blog post, we learned how to sum across columns in R. We covered various examples of when and why we might want to sum across columns in fields such as Data Science, Psychology, and Hearing Science. We have shown how to sum across columns in matrices and data frames using base R and the dplyr package. We have also demonstrated adding the summed columns to the original dataframe. I encourage readers to leave a comment if they have any questions or find any errors in the blog post. Finally, I encourage readers to share this post on social media to help others learn these important data manipulation skills.
More Tutorials:
- How to Rename Column (or Columns) in R with dplyr
- R Count the Number of Occurrences in a Column using dplyr
- How to Calculate Z Score in R
- How to Calculate Descriptive Statistics in R the Easy Way with dplyr
- How to Remove Duplicates in R – Rows and Columns (dplyr)
- How to Rename Factor Levels in R using levels() and dplyr