In this R tutorial, you will learn how to add a column to a dataframe based on values in other columns. Specifically, you will learn to create a new column using the mutate() function from the package dplyr and other useful functions.
Finally, we will also look at how to add the column, based on values in other columns, at a specific place in the dataframe. This will be done using the add_column() function from the Tibble package.
It is worth noting, that both tibble and dplyr are part of the Tidyverse package. Apart from adding columns to a dataframe, you can use dplyr to remove columns, with the select() function, for example.
Table of Contents
- Outline
- Prerequisites
- Example Data
- Add a Column to a Dataframe Based on Other Column
- Add a Column to a Dataframe in R Based on Values in Other Columns
- Create a New Column in an R dataframe Based on Values from other Columns
- Adding a Column to a dataframe in R with Multiple Conditions
- Append a Column based on Conditions & at a Specific Spot in the Dataframe
- Conclusion
- Resources
Outline
In this post, we will first learn how to install the r-packages we will use. Second, we will import example data that we can use and add columns based on conditions. After we have a dataframe, we will go on and look at how to add a column to the dataframe with values depending on other columns. In these sections, we will use the mutate() and add_column() functions to accomplish the same task. We will use these R functions to add a column based on conditions.
Prerequisites
As this is an R tutorial, you will need to have R and, at least, the dplyr package installed. If you want to e.g. easily add a column, based on values in another column, at a specific position, I suggest installing tibble. Furthermore, if you read the example .xlsx file, you will also need to install the readr package. Note, however, that if you install the tidyverse package you will get tibble, dplyr, and readr, among many other useful packages.
Installing Tidyverse lets you easily calculate descriptive statistics, visualize data (e.g., scatter plots with ggplot2). Furthermore, another useful package, part of the Tidyverse package, is called lubridate. Lubridate is very handy if you are working with time-series data. For example, you can use the functions of this package to extract year from date in R as well as extracting day and extracting time. As usual, when installing r-packages we use the install.packages() function:
install.packages(c('tibble', 'dplyr', 'readr'))Code language: R (r)Note. if you want to install all packages available in the tidyverse package, exchange the character vector for ‘tidyverse’ (install.packages(‘tidyverse’)). Now that you should be set with these useful packages, we can start reading the example Excel file.
Example Data
Here’s how to read an xlsx file in R using read_xlsx function from the readxl package:
library(readxl)

# reading the xlsx file:
depr_df <- read_excel('./SimData/add_column.xlsx')Code language: R (r)
In the code chunk above, we imported the Excel file that can be downloaded here. Furthermore, this file must be placed in the same directory as the R script (or change the path to the .xlsx file). Notice that we used the skip argument to skip the first two rows. Finally, we can have a glimpse of the data by using the head() function:
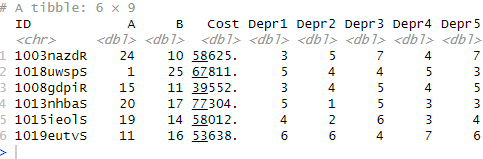
In the output, we can see that our dataset contains the following columns:
- ID – Subject ID
- A
- B
- Cost
- Depr1 – First item on a depression scale
- Depr2 – Second item
- Depr3 – And so on…
- Depr4 – …
- Depr5
Note that all variables in this data set are made up; thus, the data makes no sense. Of course, we will only use it to practice adding new columns based on conditions on values in other columns. Now that we have our data, we are directly jumping into the first example!
Add a Column to a Dataframe Based on Other Column
If we want to add a column based on the values in another column, we can work with dplyr. Here’s how to append a column based on what the factor ends within a column:
library(dplyr)
# Adding column based on other column:
depr_df %>%
mutate(Status = case_when(
endsWith(ID, "R") ~ "Recovered",
endsWith(ID, "S") ~ "Sick"
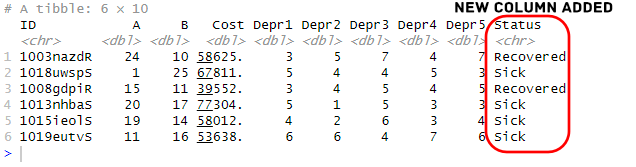
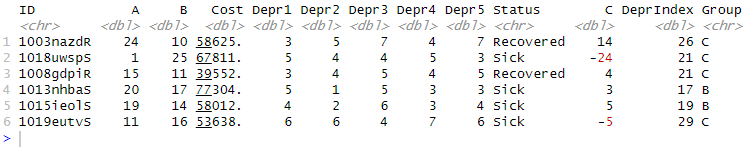
))Code language: R (r)As you can see, in the code chunk above, we used the %>% operator and the mutate() function together with the case_when() and endsWith() functions. Furthermore, we created the “Status” column (in mutate), and if the factor ended with R, the value in the new column will be “Recovered”. On the other hand, if the factor is ending with S, the value in the new column will be “Sick”. Here’s the resulting dataframe to which we appended the new column:
Now, the %>% operator is very handy, and, of course, there are more nice operators and functions in the R statistical programming environment. See the following posts for more inspiration (or information):
- How to use %in% in R: 7 Example Uses of the Operator
- Learn How to Generate a Sequence of Numbers in R with :, seq() and rep()
- How to use the Repeat and Replicate functions in R
In the next section, we will continue learning how to add a column to a dataframe in R based on values in other columns.
Add a Column to a Dataframe in R Based on Values in Other Columns
In the first example, we will add a new column based on whether the values in columns “A” and “B” match. Here’s how to add a new column to the dataframe based on the condition that two values are equal:
# R adding a column to dataframe based on values in other columns:
depr_df <- depr_df %>%
  mutate(C = if_else(A == B, A + B, A - B))Code language: R (r)
In the code example above, we added the column “C”. Here we used dplyr and the mutate() function. As you can see, we also used the if_else() function to check whether the values in column “A” and “B” were equal. If they were equal, we added the values together. If not, we subtracted the values. Here’s the resulting dataframe with the column added:
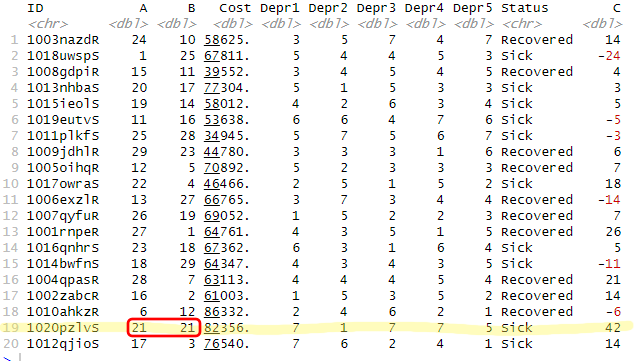
Notice how there was only one row in which the values matched, and, in that column, our code added the values together. Of course, if we wanted to create e.g., groups based on whether the values in two columns are the same or not, we can use change some things in the if_else() function. For example, we can use this code:
# creating a column to dataframe based on values in other columns:
depr_df <- depr_df %>%
  mutate(C = if_else(A == B, "Equal", "Not Equal"))Code language: PHP (php)
In the following code example, we will create a new column summarizing the values from five other columns. This can be useful, for instance, if we have collected data from e.g. a questionnaire measuring psychological constructs.
- Correlation in R: Coefficients, Visualizations, & Matrix Analysis
- Report Correlation in APA Style using R: Text & Tables
- Coefficient of Variation in R
Create a New Column in an R dataframe Based on Values from other Columns
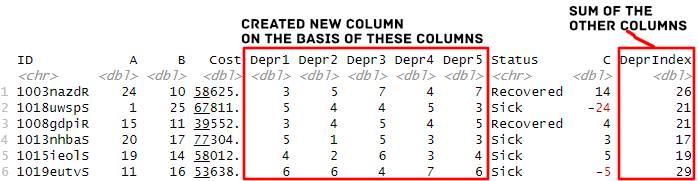
Here we are going to use the values in the columns named “Depr1” to “Depr5” and summarize them to create a new column called “DeprIndex”:
# Adding new column based on the sum of other columns:
depr_df <- depr_df %>% rowwise() %>%
  mutate(DeprIndex = sum(c_across(Depr1:Depr5)))Code language: R (r)
To explain the code above, here we also used the rowwise() function before the mutate() function. As you may understand, we use the first function to perform row-wise operations. Furthermore, we used the sum() function to summarize the columns we selected using the c_across() function.
Note, if you need to, you can rename the levels of a factor in R using dplyr, as well. In the final example, we will continue working with these columns. However, we will add a new column based on different cutoff values. That is, we will create multiple groups out of the score summarized score we have created.
Adding a Column to a dataframe in R with Multiple Conditions
In this example, we will create a new column in the dataframe based on four conditions. That is, we will use the values in the “DeprIndex” column and create 3 different groups depending on the value in each row.
# Multiple conditions when adding new column to dataframe:
depr_df %>% mutate(Group =
                     case_when(DeprIndex <= 15 ~ "A",
                               DeprIndex <= 20 ~ "B",
                               DeprIndex >= 21 ~ "C")
)Code language: R (r)
Again, we used mutate() together with case_when(). In this example, we created a new column in the dataframe and added values based on whether “DeprIndex” was smaller or equal to 15, smaller or equal to 20, or larger or equal to 25.
This is cool! We’ve created another new column categorizing each subject based on our arbitrary depression scale. We could now calculate descriptive statistics in R, by this new group if we want to. In the final example, we are going to use Tibble and the add_column() function that we used to add an empty column to a dataframe in R.
Append a Column based on Conditions & at a Specific Spot in the Dataframe
In the final example, we will use add_column() to append a column based on values in another column. Here’s how to append a column based on whether a value in one column is larger than a given value:
library(tibble)
depr_df <- depr_df %>%
  add_column(Is_Depressed =
               if_else(.$DeprIndex < 18, TRUE, FALSE),
             .after="ID")Code language: R (r)
Notice how we now use Tibble and the add_column() function. Again, we use the %>% operator, and then in the function, we use if_else(). Here’s the trick we used “.$” to access the column “DeprIndex” and if the value is larger than 18, we add TRUE to the cell in the new column. If it is smaller FALSE will be added. The new column that we have created is called “Is_Depressed” and is a boolean:
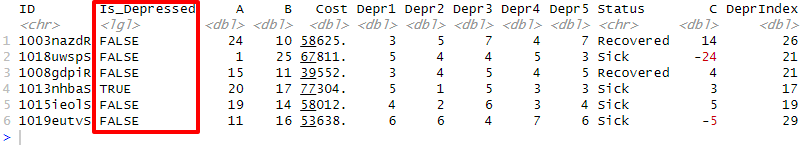
Importantly, to add the new column at a specific position, we used the .after argument. As you can see in the image above, we created the new column after the “ID” column. If we want to append our column before a specific column, we can use the .before argument. Now, you might want to continue preparing your data for statistical analysis. For more information, you can look at how to create dummy variables in R.
Conclusion
In this R tutorial, you have learned how to add a column to a dataframe based on other columns’ conditions and/or values. First, we looked at a simple example in which we created a new column based on the values in another column. Second, we appended a new column based on a condition. We checked whether the values in the two columns were the same and created a new column based on this. In the third example, we looked at more complex conditions (i.e., three conditions) and added a new variable with three different factor levels. Finally, we also had a look at how we could use add_column() to append the column where we wanted it in the dataframe.
Hope you found this post useful! If you did, share the post to show some love! Also, you can become a Patreon to support my work. Finally, make sure you leave a comment if you want something clarified or if you found an error in the post!
Resources
Here are some more resources you may find helpful:
- Correlation in R: Coefficients, Visualizations, & Matrix Analysis
- Master or in R: A Comprehensive Guide to the Operator
- Select Columns in R by Name, Index, Letters, & Certain Words with dplyr
- Modulo in R: Practical Example using the %% Operator
- How to Randomly Select Rows in R – Sample from Dataframe
- Countif function in R with Base and dplyr

Am I not seeing it, or is there no link to download add_column.xlsx ?
Oh must have forgotten to add the link. Thanks for notifying me, I have now added the link to the post and you can download it here: https://github.com/marsja/jupyter/raw/master/SimData/add_column.xlsx
Wonderful tutorial. Thanks!
Hey! Thanks for your comment. I am glad you liked it. Best, Erik
Great, thanks! Exactly what I was looking for.
Thanks Menno. Glad you liked the post!
Erik,
Late to say:
“Tusend Tak!!!”.
Great, clearly-written Tutorial…
Joe
– Ubuntu Linux
– Rstudio
San Francisco.
Tack, Joe! Glad you liked it.
Good job! Saved a lot of time.
Thanks for your comment. I glad you found the R tutorial helpful. Best /erik