In this blog post, you will learn how to carry out a countif function using base R and dplyr. Countif is a powerful function that allows you to count the number of times a certain condition is met in a dataset.
Countif is particularly useful in cognitive hearing science, where researchers often need to analyze large datasets of auditory signals. For example, you might want to use countif to count the number of times a particular sound occurs in a recording, or to count the number of times a listener correctly identifies a target sound in a speech recognition task.
The countif function can be applied to various data types, including vectors, matrices, and data frames. However, this blog post will focus on using countif on dataframes.
We will start by exploring how to use the base R function called sum(). We will show you how to use sum() to count the number of rows in a data frame that meets a specific condition.
Next, we will introduce the dplyr package, which provides a more intuitive syntax for data manipulation. We will show you how to use the mutate() and sum() functions in dplyr to achieve the same result as the sum() function many times.
Finally, we will create a custom countif function that combines the power of base R and dplyr. Our custom function will allow you to easily count the number of rows in a data frame that meet a specific condition, using a simple and intuitive syntax.
By the end of this blog post, you will have a deep understanding of how to use the countif function in R to analyze and manipulate data frames in cognitive hearing science.
Table of Contents
- Simple Example: COUNTIF in R
- Fake Data
- Countif in base R
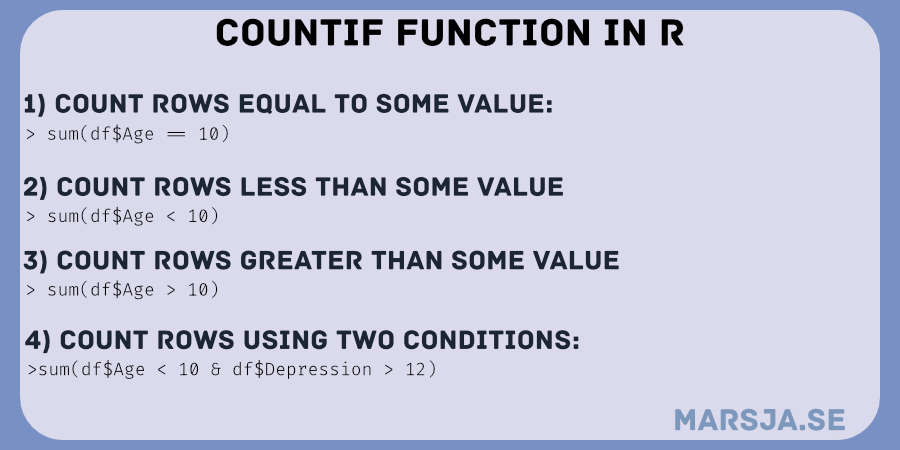
- Countif Rows Equal to Some Value
- Countif Rows Greater or Equal to Some Value
- Countif Rows Less or Equal to Some Value
- Countif Rows Between Two Values
- Countif Rows Not Equal to Some Value
- Countif using dplyr
- COUNTIF Function in R with dplyr
- Conclusion: COUNTIF function in R
- Resources
Simple Example: COUNTIF in R
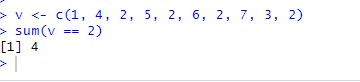
Here is a simple example of how to count values in a vector in R using a condition. We can use the sum() function as a COUNTIF function. Here is how we count how many times the value 2 appears in the vector v:
v <- c(1, 4, 2, 5, 2, 6, 2, 7, 3, 2)
sum(v == 2)Code language: HTML, XML (xml)
In the code chunk above, we used the sum() function as a countif function to count the number of occurrences of a specific value in the vector. Here, we counted how often the value 2 appears in the vector ‘v’.
In the following section, we will generate fake data to practice more advanced countif examples using both base R and dplyr.
Fake Data
Let us first create a fake dataset that we can use to practice countif in R.
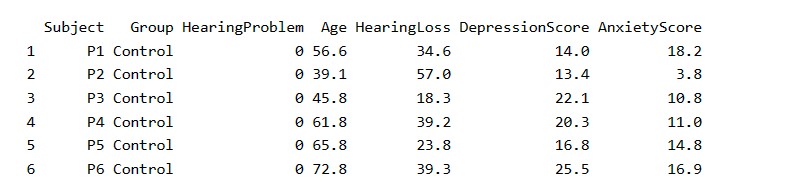
Here we will create a dataset with the following columns:
Subject: Unique identifier for each participantGroup: Categorical variable indicating the group the participant belongs to (e.g., control, experimental)HearingProblem: Binary variable indicating whether the participant reports having subjective hearing problems (0 = no, 1 = yes)Age: Continuous variable indicating the age of the participantHearingLoss: Continuous variable indicating the degree of hearing loss of the participantDepressionScore: Continuous variable indicating the level of depressive symptoms of the participantAnxietyScore: Continuous variable indicating the level of anxiety symptoms of the participant
library(dplyr)


set.seed(2023) # for reproducibility

n <- 100 # number of participants

df <- data.frame(
  Subject = paste0("P", 1:n),
  Group = rep(c("Control", "Experimental"), each = n/2),
  HearingProblem = ifelse(rbinom(n, 1, 0.5) %in% 1, 1, 0),
  Age = round(rnorm(n, mean = 50, sd = 10), 1),
  HearingLoss = round(rnorm(n, mean = 30, sd = 10), 1),
  DepressionScore = round(rnorm(n, mean = 20, sd = 5), 1),
  AnxietyScore = round(rnorm(n, mean = 15, sd = 5), 1)
) %>%
  mutate(Group = factor(Group))Code language: PHP (php)
In the code chunk above, we generate a simulated hearing study dataset using R.
To ensure reproducibility, we set the seed to 123 using set.seed().
We create a data frame called df with 100 participants using data.frame().
We used rep() to repeat the two levels of the Group variable, “Control” and “Experimental”, n/2 times each.
To set the values of the HearingProblem column, we use ifelse() and generate a random binomial distribution using rbinom(). We also use %in% in R to check if the generated value is equal to 1.
We generate random values for Age, HearingLoss, DepressionScore, and AnxietyScore using rnorm().
Finally, we use %>% to pipe the data frame into mutate() and convert the Group column to a factor using factor(). In the following sections, we will work with Base R to use the sum() function as a countif function in R.
Countif in base R
In base R, we can use the following functions as countif() functions:
- We can use
sum()to count the number ofTRUEvalues that result from a logical expression. For example,sum(x == 5)will return the number of elements in vectorxthat are equal to 5. - We can use
length()to count the number of elements in a vector or list that meet a certain condition. For example,length(x[x > 5])it will return the number of elements inxthat are greater than 5. - We can use
which()to get the indices of elements in a vector that meet a certain condition. We can then use thelength()function to count the number of indices. For example,length(which(x > 5))will return the number of elements inxthat are greater than 5.
These functions can be used in combination with logical operators, such as ==, >, <, <=, >=, and != to count the number of elements in a vector that meet a certain condition.
Countif Rows Equal to Some Value
We can use the sum() function in combination with the == operator to count the number of rows where a certain condition is met. For example, to count the number of participants who have a hearing problem, we can use the following code:
sum(df$HearingProblem == 1)Code language: R (r)Using sum() as a countif() function in R will, in this case return the number of rows in the HearingProblem column that are equal to 1. In our case, this is the number of participants with a hearing problem.
Countif Rows Greater or Equal to Some Value
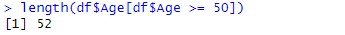
To count the number of rows where a certain condition is greater than or equal to a specific value, we can use the sum() function together with the >= operator. For example, to count the number of participants who are aged 60 or older, we can use the following code:
sum(df$Age >= 60)Code language: PHP (php)This will return the number of rows in the Age column that are greater than or equal to 60, i.e., the number of participants who are aged 60 or older.
Countif Rows Less or Equal to Some Value
To count the number of rows where a certain condition is less than or equal to a specific value, we can use the sum() function with the <= operator. For example, to count the number of participants who have a depression score less than or equal to 18, we can use the following code:
sum(df$DepressionScore <= 18)
Code language: R (r)
This will return the number of rows in the DepressionScore column that are less than or equal to 18, i.e., the number of participants who have a depression score less than or equal to 18.
Countif Rows Between Two Values
To count the number of rows where a certain condition is between two values, we can use the sum() function with the > and < operators. For example, to count the number of participants who have a hearing loss between 25 and 35, we can use the following code:
sum(df$HearingLoss > 25 & df$HearingLoss < 35)Code language: PHP (php)This will return the number of rows in the HearingLoss column that are greater than 25 and less than 35, i.e., the number of participants who have a hearing loss between 25 and 35.
Countif Rows Not Equal to Some Value
To count the number of rows where a certain condition is not equal to a specific value, we can use the sum() function with the != operator. For example, to count the number of participants who do not have a hearing problem, we can use the following code:
sum(df$HearingProblem != 1)
Code language: R (r)
This will return the number of rows in the HearingProblem column that are not equal to 1, i.e., the number of participants who do not have a hearing problem.
Countif using dplyr
Heris a countif example using dplyr functions to count the number of elements in a vector that meet a certain condition. We use the same examples as before:
library(dplyr)

df %>%
  select(HearingProblem, Age, HearingLoss, DepressionScore, AnxietyScore) %>%
  mutate(
    HearingProblemCount = sum(HearingProblem == 1),
    AgeCount = sum(Age < 60),
    HearingLossCount = sum(HearingLoss >= 20),
    DepressionScoreCount = sum(DepressionScore != 20),
    AnxietyScoreCount = sum(AnxietyScore > 10)
  )Code language: HTML, XML (xml)
In the code chunk above, we used dplyr functions to select the columns of interest from the df data frame, and then used mutate() to create new columns that count the number of elements in each column that meet a certain condition. The sum() function is used with various logical operators (==, <, >=, !=, >) to count the number of elements that meet the specified condition. Finally, the resulting data frame shows the original and new columns with the counts. Here is the result:
COUNTIF Function in R with dplyr
Here is a countif() function created in R using dplyr:
countif <- function(df, conditions) {

  df %>%
    mutate(count = 1) %>%
    # Summarize the 'count' column across all columns in the conditions list
    summarise(across(all_of(names(conditions)),
                     ~sum(count * case_when(
                       conditions[[as.name(cur_column())]][2] == "equals" &
                         .x == conditions[[as.name(cur_column())]][1] ~ 1L,
                       conditions[[as.name(cur_column())]][2] == "less" &
                         .x < conditions[[as.name(cur_column())]][1] ~ 1L,
                       conditions[[as.name(cur_column())]][2] == "greater"
                       & .x > conditions[[as.name(cur_column())]][1] ~ 1L,
                       conditions[[as.name(cur_column())]][2] == "less or equal"
                       & .x <= conditions[[as.name(cur_column())]][1] ~ 1L,
                       conditions[[as.name(cur_column())]][2] == "greater or equal"
                       & .x >= conditions[[as.name(cur_column())]][1] ~ 1L,
                       conditions[[as.name(cur_column())]][2] == "not equals"
                       & .x != conditions[[as.name(cur_column())]][1] ~ 1L,
                       TRUE ~ 0L)))) %>%
    set_names(names(conditions))

}Code language: R (r)
The function countif() takes two arguments: df, which is a dataframe, and conditions. Conditions is a list of conditions with the column names as names and the values and logical operators as vectors. The function counts the number of rows in “df” that satisfy the conditions and returns the counts as a named vector.
The function has the limitation that it can only handle one condition at a time, and the logical operators supported are limited to “equals”, “less”, “greater”, “less or equal”, “greater or equal”, and “not equals”. As to date, I have not solved having it to take multiple conditions as in the examples previously in the post.
Conclusion: COUNTIF function in R
In this blog post, you have learned about the COUNTIF function in R. Starting with a fake dataset, we explored how to count rows. Specifically, we counted rows equal to, greater or equal to, and less or equal to some value. We also looked at how to count rows between two values and rows not equal to some value using base R. After that, we created a general function using dplyr to count rows based on different conditions. This function takes two arguments. First the dataframe and then a list of conditions. This list contains three elements: column name, operator, and value. The function then returns a new data frame with the counts for each condition. Finally, we introduced the COUNTIF function in dplyr, a more concise way to perform the same operation.
Overall, the COUNTIF function in R is a powerful data analysis tool commonly used to filter, manipulate, and transform data. Automating the counting process can save you time and effort, allowing you to focus on more complex tasks. By mastering this function, you can improve your data analysis skills and become more efficient in R.
If you found this blog post helpful, consider sharing it on social media or leaving a comment below. We always appreciate feedback and suggestions for future posts. Thank you for reading!
Resources
Here are some other resources you might find useful:
- How to Convert a List to a Dataframe in R – dplyr
- R Count the Number of Occurrences in a Column using dplyr
- How to Rename Column (or Columns) in R with dplyr
- How to Add a Column to a Dataframe in R with tibble & dplyr
- R: Add a Column to Dataframe Based on Other Columns with dplyr
- How to Standardize Data in R
- How to Calculate Z Score in R