In this blog post, we will explore the Wilcoxon Signed-Rank test in Python, a non-parametric test for comparing two related samples. We will learn about its hypothesis, uses in psychology, hearing science, and data science.
To carry out the Wilcoxon Signed-Rank test in Python, we will generate fake data and import real data. We will also perform the Shapiro-Wilks test to check for normality.
We will then move on to implementing the Wilcoxon Signed-Rank test in Python and interpreting the results. Additionally, we’ll visualize the data to better understand the test results.
Finally, we will learn how to report the results of the Shapiro-Wilks test for normality and the Wilcoxon Signed-Rank test. This will provide valuable insights into the relationship between the two related samples. By the end of this blog post, you will have a comprehensive understanding of the Wilcoxon Signed-Rank test. Importantly, you will know how to perform the test in Python and how to apply it to your data analysis projects.
Remember to consider alternatives, such as data transformation, when data does not meet the assumptions of the Wilcoxon Signed-Rank test.
Table of Contents
- The Wilcoxon Signed-Rank Test
- Examples of Uses of the Wilcoxon Signed-Rank Test
- Requirements for carrying out the Wilcoxon Singed-Rank test in Python
- SciPy & the wilcoxon() Syntax
- Other Python Packages to use to run the Wilcoxon Signed-Rank test
- Fake Data
- Importing Data
- Test for Normality in Python (Shapiro-Wilks)
- Wilcoxon Signed-Rank test in Python
- Interpet Wilcoxon Signed-Rank test
- Visualizing Data
- Report the Shapiro-Wilks test for Normality and The Wilcoxon Signed-Rank Test
- Comparing Pingouin, SciPy, and researchpy
- Resources
The Wilcoxon Signed-Rank Test
The Wilcoxon signed-rank test is a non-parametric statistical test used to determine whether two related samples come from populations with the same median. We can use this non-parametric test when our data is not normally distributed. This test can be used instead of a paired samples t-test.
The test is conducted by ranking the absolute differences between paired observations, considering their signs. Next, the sum of the ranks for the positive differences is calculated and compared to the sum of the negative differences. The test statistic is then calculated as the smaller of these two sums.
The Hypothesis of the Wilcoxon Signed-Rank Test
The test has two possible outcomes: reject or fail to reject the null hypothesis. If the test rejects the null hypothesis, the two samples come from populations with different medians. If it fails to reject the null hypothesis, there is no evidence to suggest that the two samples come from populations with different medians.
The null hypothesis for the Wilcoxon signed-rank test is that the difference between the two related samples is zero. The alternative hypothesis is that the difference between the two related samples is not zero.
Examples of Uses of the Wilcoxon Signed-Rank Test
Here are three examples from psychology, hearing science, and data science when we may need to use the Wilcoxon signed-rank test:
Psychology
Suppose we want to investigate whether a new therapy for depression is effective. We could administer a depression questionnaire to a group of patients before and after the therapy and then use the Wilcoxon signed-rank test to determine if there is a significant improvement in depression scores after the therapy.
Hearing Science
Suppose we want to compare the effectiveness of two different hearing aids. We could measure the hearing ability of a group of participants with each hearing aid and then use the Wilcoxon signed-rank test to determine if there is a significant difference in hearing ability between the two hearing aids.
Data Science
Suppose we want to investigate whether there is a significant difference in the time for two different algorithms to complete a task. We could run each algorithm multiple times and then use the Wilcoxon signed-rank test to determine if there is a significant difference in completion times between the two algorithms.
Requirements for carrying out the Wilcoxon Singed-Rank test in Python
You will need a few skills and software packages to carry out the Wilcoxon signed-rank test in Python. Here is an overview of what you will need:
- Basic programming skills: You should be familiar with the Python programming language and its syntax. You should also have a basic understanding of statistics and hypothesis testing.
- Python environment: You must set up a Python environment on your computer. One popular option is the Anaconda distribution, with many useful packages pre-installed.
- Python packages: You must install the SciPy package, which contains the function to perform the Wilcoxon signed-rank test. You can install the SciPy package using the following command in your terminal or command prompt:
pip install scipyCode language: Bash (bash)Alternatively, you can use conda to install SciPy:
conda install scipyCode language: Bash (bash)Using pip or conda will install the latest version of SciPy and its dependencies into your Python environment. If you are using a specific version of Python, you may need to specify the version of SciPy that is compatible with your Python version. See this blog post: Pip Install Specific Version of a Python Package: 2 Steps.
It is often helpful to use Pandas to read data files and perform exploratory data analysis before conducting statistical analyses such as the Wilcoxon signed-rank test.
Here is how you can install Pandas using pip and conda:
Install Pandas using pip:
pip install pandasCode language: Bash (bash)Install Pandas using conda:
conda install pandasCode language: Bash (bash)In addition to SciPy, we also use Seaborn and NumPy in this post. To follow along, you will need to install these packages using the same methods mentioned earlier.
SciPy & the wilcoxon() Syntax
SciPy is a Python library for scientific and technical computing that provides modules for optimization, integration, interpolation, and statistical functions.
Syntax of the wilcoxon() Function
The Wilcoxon signed-rank test is one of the statistical functions provided by SciPy’s stats module. The function used to perform the test is called wilcoxon(), and it takes two arrays of matched samples as inputs.
The basic syntax of the wilcoxon() function is as follows:
from scipy.stats import wilcoxon

statistic, p_value = wilcoxon(x, y, zero_method='wilcox',
                                alternative='two-sided')Code language: Python (python)
where x and y are the two arrays of matched samples to be compared, zero_method is an optional parameter that specifies how zero-differences are handled, and the alternative is another optional parameter that specifies the alternative hypothesis. The function returns the test statistic and the p-value.
Other Python Packages to use to run the Wilcoxon Signed-Rank test
There are several Python packages that can be used to perform the Wilcoxon signed-rank test in addition to SciPy. Here are three examples:
- Statsmodels is a Python library for fitting statistical models and performing statistical tests. It includes implementing the Wilcoxon signed-rank test in Python and other non-parametric tests.
- Pingouin is a statistical package that provides a wide range of statistical functions for Python. It includes an implementation of the Wilcoxon signed-rank test as well as other statistical tests and functions.
- Researchpy is a Python library for conducting basic research in psychology. It includes implementing the Wilcoxon Signed-Rank and other statistical tests commonly used in psychology research.
All three packages are open-source and can be installed using pip or conda. They provide similar functionality to SciPy for performing the Wilcoxon signed-rank test in Python.
Fake Data
Let us assume that we conducted a study to investigate the effect of a mindfulness intervention on working memory performance and anxiety levels in a sample of undergraduate students. The dataset consists of two dependent variables (N1 and N2) measured twice (pre-test and post-test). N1 represents participants’ performance in a working memory task, while N2 represents the level of anxiety experienced during the task. The pre-test and post-test measures were taken one week apart. Here is how to generate the fake data set in Python:
import pandas as pd
import numpy as np
from scipy.stats import norm, skewnorm

# Set the random seed for reproducibility
np.random.seed(123)

# Generate normally distributed data (dependent variable 1)
n1_pre = norm.rvs(loc=20, scale=5, size=50)
n1_post = norm.rvs(loc=25, scale=6, size=50)

# Generate skewed data (dependent variable 2)
n2_pre = skewnorm.rvs(a=-5, loc=20, scale=5, size=50)
n2_post = skewnorm.rvs(a=-5, loc=25, scale=6, size=50)

# Create a dictionary to store the data
data = {'N1_pre': n1_pre, 'N1_post': n1_post, 'N2_pre': n2_pre, 'N2_post': n2_post}

# Create a Pandas DataFrame from the dictionary
df = pd.DataFrame(data)

# Print the first few rows of the DataFrame
print(df.head())Code language: Python (python)
In the code chunk above, we first import the necessary Python libraries: Pandas, NumPy, and scipy.stats.
We then set the random seed to ensure that the data we generate can be reproduced. Next, we generate normally distributed data for the dependent variable N1, both pre- and post-test. We also generate skewed data for the dependent variable N2, both pre- and post-test. We create a Python dictionary to store the generated data, with keys corresponding to the variable names. Finally, we create a Pandas DataFrame from the dictionary to store and manipulate the data.
Importing Data
In real-life research, scientists and data analysts import data from their experiments, studies, or surveys. These datasets are often quite large, and analysts must process, clean, and analyze them to extract meaningful insights.
Python is a popular programming language for data analysis, and it supports a wide range of data formats. This makes importing and working with data from different sources and tools easy. For example, Python can read the most common data files such as CSV, Excel, SPSS, Stata, and more. Here are some tutorials on how to import data in Python:
- How to Read SAS Files in Python with Pandas
- Your Guide to Reading Excel (xlsx) Files in Python
- Pandas Read CSV Tutorial: How to Read and Write
- How to Read & Write SPSS Files in Python using Pandas
- Tutorial: How to Read Stata Files in Python with Pandas
Test for Normality in Python (Shapiro-Wilks)
We start by testing the generated data for normality using the Shapiro-Wilks test:
from scipy.stats import shapiro

# Check normality of N1 (pre-test)
stat, p = shapiro(df['N1_pre'])
print('N1 pre-test:', 'Statistics=%.3f, p=%.3f' % (stat, p))
if p > 0.05:
    print('N1 pre-test data is normally distributed')
else:
    print('N1 pre-test data is not normally distributed')

# Check normality of N1 (post-test)
stat, p = shapiro(df['N1_post'])
print('N1 post-test:', 'Statistics=%.3f, p=%.3f' % (stat, p))
if p > 0.05:
    print('N1 post-test data is normally distributed')
else:
    print('N1 post-test data is not normally distributed')

# Check normality of N2 (pre-test)
stat, p = shapiro(df['N2_pre'])
print('N2 pre-test:', 'Statistics=%.3f, p=%.3f' % (stat, p))
if p > 0.05:
    print('N2 pre-test data is normally distributed')
else:
    print('N2 pre-test data is not normally distributed')

# Check normality of N2 (post-test)
stat, p = shapiro(df['N2_post'])
print('N2 post-test:', 'Statistics=%.3f, p=%.3f' % (stat, p))
if p > 0.05:
    print('N2 post-test data is normally distributed')
else:
    print('N2 post-test data is not normally distributed')Code language: Python (python)
In the code chunk above, we first import the Python shapiro() function from the scipy.stats module. This function is used to calculate the Shapiro-Wilk test statistic and p-value, which are used to test the normality of a dataset.
Next, we call the shapiro() function four times, once for each combination of the dependent variable and pre/post-test measure. We pass the relevant subset of the dataframe to the function as an argument. Here we used indexing to select the appropriate columns.
The shapiro() function returns two values: the test statistic and the p-value. We store these values in the variables stat and p, respectively, using tuple unpacking.
Finally, we print the results of the normality tests using print statements. We check whether the p-value is greater than 0.05, the common significance level used in hypothesis testing. If the p-value is greater than 0.05, we conclude that the data is normally distributed; if it is less than or equal to 0.05, we conclude that the data is not normally distributed.
Overall, this code chunk allows us to quickly and easily test the normality of each variable and pre/post-test measure combination, which is an important step in determining whether the Wilcoxon signed-rank test is an appropriate statistical analysis to use.
Wilcoxon Signed-Rank test in Python
To carry out the Wilcoxon signed-rank test in Python on the n2 variable, we can use the wilcoxon function from the scipy.stats module. Here is an example code chunk:
from scipy.stats import wilcoxon

# Subset the dataframe to include only the n2 variable and pre/post-test measures
n2_data = df[['N2_pre', 'N2_post']]

# Carry out the Wilcoxon signed-rank test on the n2 variable
stat, p = wilcoxon(n2_data['N2_pre'], n2_data['N2_post'])

# Print the test statistic and p-value
print("Wilcoxon signed-rank test for n2:")
print(f"Statistic: {stat}")
print(f"p-value: {p}")Code language: Python (python)
In the code chunk above, we begin by importing the wilcoxon() function from the scipy.stats module.
Next, we subset the original dataframe only to include the N2 variable and its pre/post-test measures. This is stored in the n2_data variable.
We then use the wilcoxon() function to carry out the Wilcoxon signed-rank test in Python on the N2 dataframe. The wilcoxon() function inputs the N2_pre and N2_post columns from the n2_data subset.
The test statistic and p-value are then returned by the wilcoxon() function and stored in the stat and p variables, respectively.
Finally, we print the test results using print statements, including the test statistic and p-value. Here are the results:
Interpet Wilcoxon Signed-Rank test
To interpret the results, we can start by looking at the p-value. Suppose the p-value is less than our chosen significance level (usually 0.05). In that case, we reject the null hypothesis and conclude that there is a significant difference between the two dependent measures. Our results suggest a significant effect between the pre- and post-test.
In addition to the p-value, we can also look at the test statistic. The sign of the test statistic indicates the direction of the change. For example, the direction is positive if the post-test measure is greater than the pre-test. Moreover, it is negative if the post-test measure is less than the pre-test.
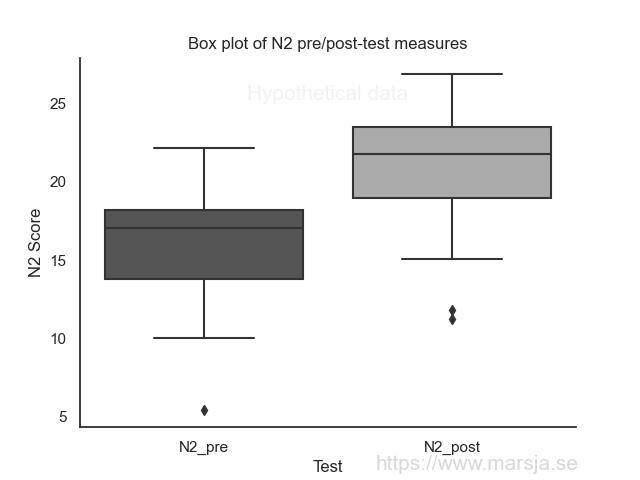
To visualize the data, we could create a box plot of the N2 variable for pre- and post-test measures. This would allow us to see the distribution of the data and any potential outliers. We could also add a line connecting the pre- and post-test measures for each participant to visualize each individual’s score change.
Visualizing Data
We can use the seaborn library to create a box plot of the N2 variable for both the pre- and post-test measures. Here is an example code chunk:
import seaborn as sns

# Create a box plot of the N2 variable for pre/post-test measures
boxp = sns.boxplot(data=n2_data, palette="gray")

# This will add title to plot
boxp.set_title("Box plot of N2 pre/post-test measures")

# Adding a label to X-axis
boxp.set_xlabel("Test")

# Adding a label l to Y-axis
boxp.set_ylabel("N2 Score")

# Removing the Grid
boxp.grid(False)

# Only lines on y- and x-axis
sns.despine()

# White background:
sns.set_style("white")Code language: Python (python)
In the code chunk above, we first import the Seaborn data visualization library. We then create a box plot using Seaborn’s boxplot() function, passing it the data to be plotted. The palette argument specifies the color palette to be used for the plot. We set the title, x-label, and y-label of the plot using the set_title(), set_xlabel(), and set_ylabel() methods of the boxplot object. Next, we remove the grid using the grid() method of the boxplot object. Moreover, we remove the top and right spines of the plot using the despine() function of Seaborn. Finally, we set the plot style to “white” using the set_style() method of Seaborn. For more data visualization tutorials:
- How to Make a Violin plot in Python using Matplotlib and Seaborn
- Seaborn Line Plots: A Detailed Guide with Examples (Multiple Lines)
- How to Make a Scatter Plot in Python using Seaborn
Here is the boxplot:
Report the Shapiro-Wilks test for Normality and The Wilcoxon Signed-Rank Test
A Shapiro-Wilk test was conducted to check for normality in the data. The results indicated that N1 pre-test data were normally distributed (W(30) = 0.985, p = 0.774) and N1 post-test data was also normally distributed (W(30) = 0.959, p = 0.077). However, N2 pre-test data was not normally distributed (W(30) = 0.944, p = 0.019) and neither was N2 post-test data (W(30) = 0.937, p = 0.010).
A Wilcoxon signed-rank test was conducted to compare the pre and post-test scores of N2. The results indicated that there was a significant difference between the pre and post-test scores of N2 (W(31) = 63.0, p < 0.001). Naturally, we would report the N1 test (e.g., results from a paired sample t-test conducted in Python).
When the Assumptions Are not Met
If the assumptions of the Wilcoxon Signed-Rank test are not met, other non-parametric tests, such as the Kruskal-Wallis test or Friedman test, may not be appropriate. In such cases, alternative techniques such as bootstrapping or robust regression (most likely not) may be needed.
Several methods can be used to analyze non-normal data, including data transformation, bootstrapping, permutation tests, and robust regression. See this blog post for transforming data:
It is important to consider the specific characteristics of the data and the research question when choosing an appropriate technique.
Comparing Pingouin, SciPy, and researchpy
Before we conclude this tutorial, we will have quick look on two other packages. What are the benefits of using, e.g., Pingouin to perform the Wilcoxon Signed-Rank test in Python?
SciPy and Pingouin provide similar functionalities and syntax for the Wilcoxon signed-rank test. However, Pingouin offers additional statistical tests and features, making it a more comprehensive statistical package.
ResearchPy, on the other hand, provides a simple interface for conducting various statistical tests, including the Wilcoxon signed-rank test. However, it has limited functionality compared to both SciPy and Pingouin.
The advantages of using Pingouin over SciPy and ResearchPy are:
- It offers a wide range of statistical tests beyond the Wilcoxon signed-rank test, making it a more comprehensive statistical package.
- It provides a simple and easy-to-use syntax for conducting various statistical tests, making it more accessible to beginners and non-experts.
- It provides detailed statistical reports and visualizations useful for interpreting and presenting statistical results.
However, SciPy and ResearchPy are still valuable statistical packages, especially if one only needs to conduct basic statistical tests. The choice between these packages ultimately depends on the user’s needs and preferences.
Conclusion: Wilcoxon Signed-Rank Test in Python
In this blog post, we learned about the Python Wilcoxon Signed-Rank test. It is a non-parametric statistical test that compares two related samples.
We discussed its hypothesis, and applications in psychology, hearing science, and data science. We also covered the requirements for conducting the test in Python.
This included generating fake data, importing data, testing for normality using the Shapiro-Wilks test, and implementing the Wilcoxon Signed-Rank test. We saw how to interpret the results and visualize data using Python.
The Wilcoxon Signed-Rank test is an essential tool for data analysis. It provides valuable insights into the relationship between two related samples, enabling informed decision-making.
We hope this post has helped you understand the Wilcoxon Signed-Rank test better. Please share on social media and comment below with any questions or feedback. Your input helps us improve and create more valuable content for you.
Resources
Here are some more tutorials you may find helpful:
- Python Check if File is Empty: Data Integrity with OS Module
- Coefficient of Variation in Python with Pandas & NumPy
- Find the Highest Value in Dictionary in Python