On this page, you will find links to all the Pandas tutorials on this site. For instance, you will find a basic Pandas dataframe tutorial as well as more specific tutorials on how to group your data, create dummy variables, take random samples from data, among other guides.
Pandas Dataframe Tutorials
In the Basic Pandas Dataframe Tutorial, you will get an overview of how to work with Pandas dataframe objects. Furthermore, you will learn how to install Pandas, how to create a dataframe from a Python dictionary, import data (i.e., from Excel and CSV), use some of Pandas data frame methods, get the column names, and many more.
Creating Dataframes
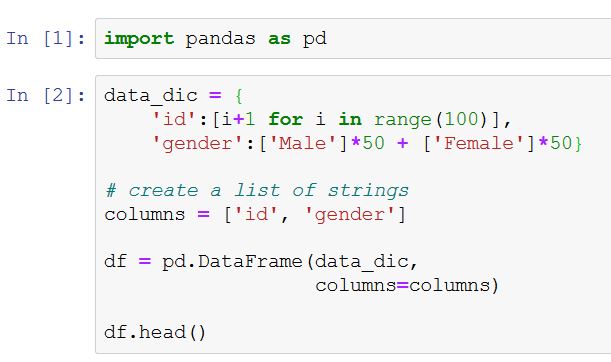
Now, there are a couple of methods to create Pandas dataframmes. First of all, and maybe the most common methods are to import data from an external source. If you, on the other hand, already have your data stored in Python objects you can of course convert many objects to dataframes. For example, if you have a Python dictionary you can convert it to a dataframe. Another example, is to convert a NumPy array to a Pandas dataframe. Interestingly, both of these conversion methods make use of the DataFrame class.
How to Import Data in Python using Pandas
In this section, you will find the tutorials focusing on how to load data into Pandas dataframe. These might be useful when you want to advance your knowledge. That is after you’ve read the basic dataframe tutorial and need to read data from formats such as JSON, HTML tables, SPSS, or SAS.
Parsing JSON files in Python with Pandas (and the json module)
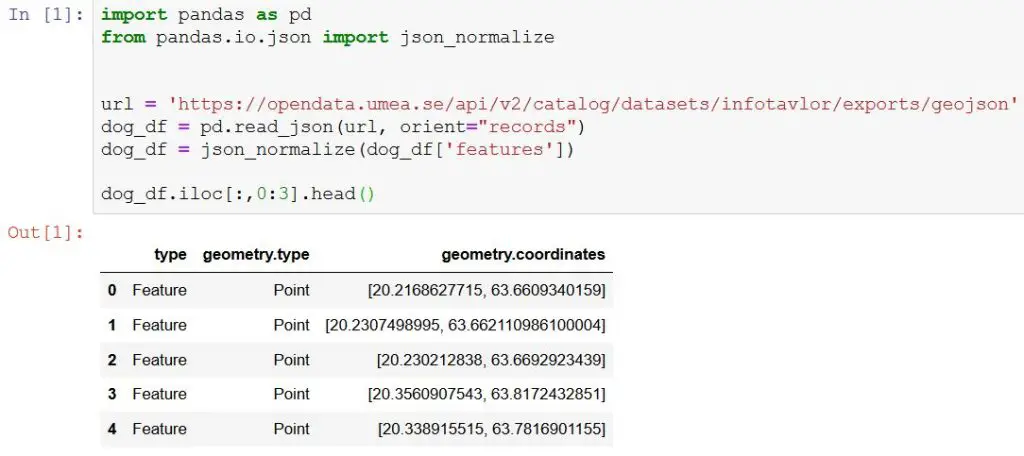
- Parsing JSON files using Python and Pandas. In this post, you will learn how to use Pythons json module to parse JSON files. Furthermore, you will learn how to read JSON files into Pandas dataframes.
- In the post, how to convert JSON to Excel in Python, you will learn how to read JSON data with Python and converting it to an Excel (.xlsx) file. It is quite easy and we will use the json, requests modules, and the Pandas package. In this JSON to Excel tutorial, you will learn how to read JSON from your local disk and a URL (with requests) and saving it as a .xlsx file.
Reading Excel files using Pandas
- How to use Pandas read_excel and to_excel to read and write Excel files in Python. In this post, you will learn how to use Pandas read_excel to read .xlsx files into Pandas dataframes. Furthermore, you will learn how to read multiple sheets and concatenate these to one dataframe, read multiple Excel files to one dataframe. Finally, you will also learn how to write dataframes to Excel files.
How to Read CSV files in Python using Pandas
- In the post, Pandas Read CSV Tutorial: How to Read and Write you will learn how to use Pandas read_csv and to_csv methods to read and write .csv files. Specifically, you will learn all you need about importing data from CSV files (including from multiple .csv files), how to write Pandas dataframes to a CSV file.
Importing Data from Other Statistical Software (e.g., SAS, SPSS, Stata)
Here you will find links to the tutorials focusing on how to import data from the formats other statistical software uses. Specifically, you will learn how to:
- In the post, how to read SAS files in Python with Pandas, you will learn how to read .sas7bdat files to Pandas dataframes.
- If you are collaborating with people using SPSS you may want to read (and write) .sav files using Python and Pandas.
- In the post, tutorial: how to read Stata files in Python with Pandas, you will learn how to read Stata files.
Reading Data from HTML Tables with Pandas read_html Method
Now, one cool thing with Pandas is that there is a method for scraping data from the Web; read_html. In a Pandas tutorial, you will learn how to get data from HTML tables using Pandas read_html.
Working with Pandas Dataframes
In this section, you will find the Pandas tutorial focusing on how to work with Pandas dataframes. For instance, you may work with categorical data and need to group the data, or create dummy variables for later analysis (e.g., regression analysis). Furthermore, you may want to take random samples from your data, need to subset or slice your data.
For instance, after importing your data using Pandas you may want to use Pandas to get column names of your dataset (e.g., if someone else collected the data, it might be useful).
Grouping Categorical Variables in Dataframes: Pandas Groupby Tutorial
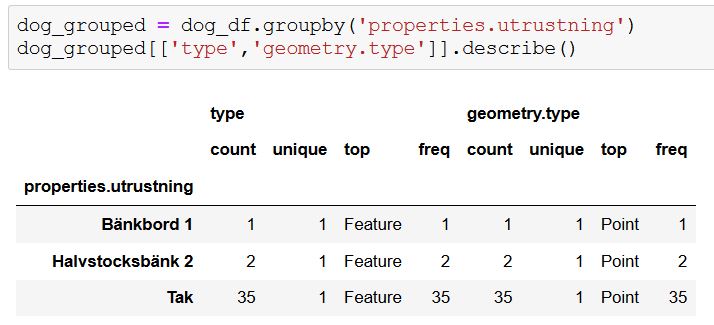
In the Pandas groupby tutorial, on how to group categorical data, you will learn how to use Pandas groupby() method. Specifically, this grouping in Pandas tutorial focuses on how to group data by both one variable (or category) or multiple categories. Furthermore, it will also cover some basic descriptive statistics calculations that you may find useful.
Slicing, Indexing, Manipulating & Cleaning Data
In this section, you will find the tutorials about slicing, indexing, and subsetting Pandas dataframes. Furthermore, you will find the Pandas how-tos focusing on how to manipulate and clean data in Python with Pandas.
- If you need to clean your data, the post the easiest data cleaning method in Python Pandas is for you. Here, you will learn to simplify our data preprocessing work using Pyjanitor. Among other things, you will learn how to add a column, remove missing values, remove empty columns, and clean up column names.
- How to use iloc and loc for indexing and slicing Pandas dataframes is a post for you. Especially, if you need to know the difference between iloc and loc, how to use these methods. You’ll learn about slicing and indexing your Pandas dataframes.
- If you need to reverse your rows or columns check the Pandas tutorial on how to reverse Pandas dataframes.
- If you are working with questionnaire data you often need to reverse scores on some items. See the post on how to do reverse scoring in Python for more information.
- Pandas drop_duplicates() is a method for dropping duplicated rows from a dataframe. In a new post, you will learn how to work with this method to delete rows both where all cells are the same and when a subset of the rows are the same.
Taking Random Samples from Data using Pandas sample() Method
- Sometimes, we may need to take a random sample from our data. Now, this is exactly what the post about how to use Pandas sample() method is about. In this post, you will learn how to take random samples of rows and columns.
Using Pandas get_dummies() to Make Dummy Variables in Python
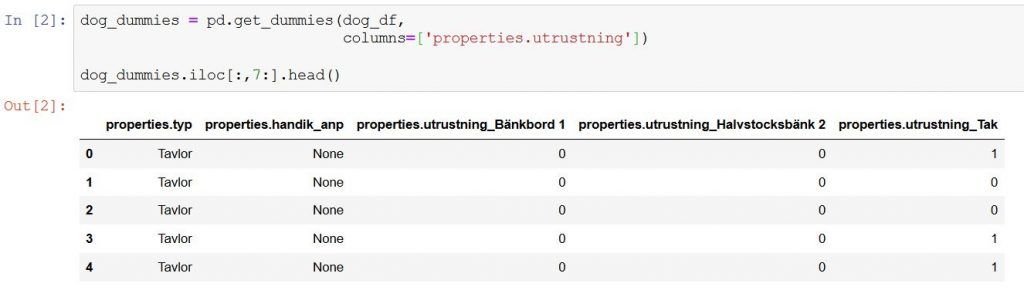
In the post, how to use Pandas get_dummies() to create dummy variables in Python, you will learn how to make dummy variables. Specifically, you will learn dummy coding in Python from one or many categorical variables.
In a recent post, you can learn how to convert a Pandas dataframe to a Numpy array.
Adding Columns to the Dataframe in Pandas
In some cases, you might need to add new columns to the dataframe. For instance, if you want to create empty columns you can learn this in the tutorial about how to add empty columns to the dataframe in Pandas. Now, sometimes we also have data from other sources and needs to know how we can get this into an existing dataframe. In the post, Adding New Columns to a Dataframe in Pandas (with Examples), you’ll learn how to add data to a dataframe in Pandas.
Renaming Columns in Pandas Dataframe
If you are scraping data from the web, or analyzing data collected by someone else, you may need to change the column names in the Pandas dataframe. For instance, there may be really long variable names in the dataset and you may want shorter names to make it easier to work with. In a Pandas tutorial, on this blog, you will learn all you need about renaming columns in Pandas dataframes.
Exploratory Data Analysis in Python
In this section, you will find posts about how to carry out exploratory data analysis in Python. For instance, you will learn how to carry out descriptive statistics in Python, some basic plots, and correlational analysis.
Descriptive Statistics in Python using Pandas
If we need to explore our data we can use Pandas, NumPy, and SciPy to carry out summary statistics in Python. It is very easy, of course, and Pandas have a range of methods for doing so. Naturally, the post descriptive statistics in Python using Pandas will cover all of this.
Exploring using Visualization in Python
Now, this post, will give you an overview of how to read HTML tables (e.g., from Wikipedia), clean the data, carry out explorative data analysis, and plot the data using Python. In the post, you will use NumPy, SciPy, Pandas, and Seaborn.
Count Occurrences in Column
Whether you are intersted in getting the sample size in eg. each group in your dataset or want to explore relationships you might end up in only want to count unique values in a column. Luckily, there’s a post in which you will learn how to use Pandas value_counts() to count occurences of elements in a column.