Descriptive statistics in Python are easy to calculate with Pandas. Whether you want a quick overview of your data or need summary statistics before fitting a statistical model, Pandas includes built-in functions for the most common descriptive measures. In this tutorial, you’ll learn how to calculate descriptive statistics for a Pandas DataFrame and interpret the output.
We will start by creating a small example dataset and then use Pandas to generate summary statistics. Along the way, you will learn how to calculate measures of central tendency, including the mean and median, as well as measures of variability such as the standard deviation and variance. Finally, you will see how to export the results to a CSV file for reporting or further analysis.
Descriptive Statistics
After data collection, most Psychology researchers use different ways to summarise the data. In this tutorial, we will learn how to do descriptive statistics in Python. Python, as a programming language, offers many ways to perform descriptive statistics.
Pandas is a useful library for data manipulation and summary statistics in Python. In the simplest form, we can calculate descriptive statistics in Python with DataFrame.describe(). See the later in the post for how to use describe() to calculate summary stats.
If you have experience with R, Pandas will probably feel familiar. The DataFrame is conceptually similar to R’s data.frame, making it relatively easy to switch between the two. In this tutorial, we will primarily use Pandas to calculate descriptive statistics. We will also use NumPy and SciPy for measures that are not available directly in Pandas, including the geometric, harmonic, and trimmed means.
import numpy as np
from pandas import DataFrame as df
from scipy.stats import trim_mean, kurtosis
from scipy.stats.mstats import mode, gmean, hmeanCode language: Python (python)
Simulate Data Using Python and NumPy
Before calculating descriptive statistics, we need some data to work with. In this example, we will simulate data from a simple experiment in which response time is the dependent variable. Response time is a common outcome measure in experimental psychology, making it a useful example for this tutorial.
The simulated dataset contains two independent variables: iv1 with two levels and iv2 with three levels. We will create the dataset as a Pandas DataFrame and use it throughout the tutorial to compute descriptive statistics.
N = 20
P = ["noise","quiet"]
Q = [1,2,3]

values = [[998,511], [1119,620], [1300,790]]

mus = np.concatenate([np.repeat(value, N) for value in values])

data = df(data = {'id': [subid for subid in range(N)]*(len(P)*len(Q))
    ,'iv1': np.concatenate([np.array([p]*N) for p in P]*len(Q))
    ,'iv2': np.concatenate([np.array([q]*(N*len(P))) for q in Q])
    ,'rt': np.random.normal(mus, scale=112.0, size=N*len(P)*len(Q))})Code language: Python (python)
Import Data in Python
In the example above, we simulated data. We can, of course, use our own stored data. If you need to know how to work with Excel files, see this Pandas read and write Excel files tutorial. Furthermore, it is also possible to load data into a Pandas dataframe is to read CSV files with the read_csv() method.
Finally, we can import data from SPSS files, SAS (.dta) files, and Stata (.7bdat) files using Pandas. Now, it is also possible to read other types of files with just Python, so make sure to check out the post about how to read a file in Python. Notice, to calculate summary statistics for specific columns we need to know the variable names in the dataset. One way to do this is to get the column names using the columns method.
Descriptive statistics using Pandas in Python
In this section, we will use Pandas describe method to carry out summary statistics in Python.
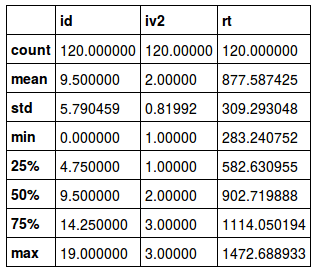
data.describe()Code language: Python (python)Pandas will output summary statistics using this method. The output is a table, as you can see below.
Typically, a researcher is interested in the descriptive statistics of the IVs. Therefore, we group the data by these (i.e., iv1, iv2). Again, using the describe method on the grouped data, we get summary statistics for each level in each IV.
As the output shows, it is somewhat hard to read. Note: the method unstack is used to get the mean, standard deviation (std), etc as columns, and it becomes somewhat easier to read.
grouped_data = data.groupby(['iv1', 'iv2'])
grouped_data['rt'].describe().unstack()Code language: Python (python)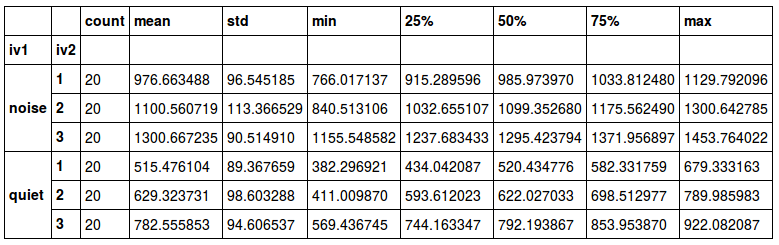
For more on how to use Pandas groupby method, see the Python Pandas Groupby Tutorial. If you, on the other hand, don’t have any grouping variable you can use the describe method on your dataframe (e.g., data in this example). If you only need to get the unique values of, e.g. a factor, you can use Pandas value_counts() to count occurrences in a column.
Central tendency in Python
In this Python descriptive statistics tutorial, we will focus on the measures of central tendency. Often, we want to know something about the “average” or “middle” of our data. Using Pandas and NumPy, the two most commonly used measures of central tendency can be obtained: the mean and the median. Moreover, the mode and the trimmed mean can also be obtained using Pandas, but I will use methods from SciPy.
Pandas Mean
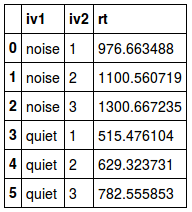
If we are only interested in one summary statistic, we can calculate it separately. When we use Pandas, there are at least two ways to do this with our grouped data. First, Pandas has the method mean;
grouped_data['rt'].mean().reset_index()Code language: Python (python)But the aggregate method in combination with NumPys mean can also be used;
grouped_data['rt'].aggregate(np.mean).reset_index()Code language: Python (python)Both methods will give the same output, but the aggregate method has some advantages that I will explain later.
Here is a YouTube Video on how to use Pandas describe() to do descriptive stats:
Geometric & Harmonic Mean in Python
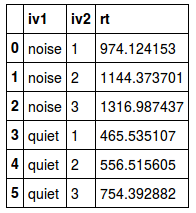
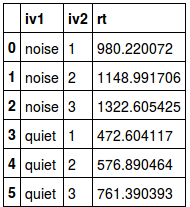
Sometimes, when calculating summary statistics, the geometric or harmonic mean may be of interest. In Python, these two descriptive statistics can be obtained using the method apply with the methods gmean and hmean (from SciPy) as arguments. That is, there is no method in Pandas or NumPy that enables us to calculate geometric and harmonic means.
Geometric Mean using Scipy & Pandas
In Pandas, we can use the apply method to input another function, such as gmean from SciPy. In the next Pandas descriptive statistics examples, we are going to use apply.
grouped_data['rt'].apply(gmean, axis=None).reset_index()Code language: Python (python)Harmonic using Scipy & Pandas
In this Python Pandas summary statistics example, we use apply together with hmean to obtain the harmonic mean:
grouped_data['rt'].apply(hmean, axis=None).reset_index()Code language: Python (python)Trimmed Mean in Python
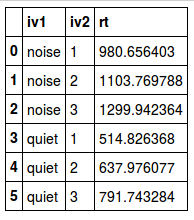
Trimmed means are sometimes used. Pandas or NumPy doesn’t seem to have methods for computing the trimmed mean. However, we can use the method trim_mean from SciPy . By using apply to our grouped data, we can use the function (trim_mean') with an argument that will remove 10% of the largest and smallest values.
trimmed_mean = grouped_data['rt'].apply(trim_mean, .1)
trimmed_mean.reset_index()Code language: JavaScript (javascript)
Output from the mean values above (trimmed, harmonic, and geometric means):
|
|
|
Pandas Median
In Python, using Pandas, there are two methods to calculate the median. In the example below, we use Pandas median and aggregate together with NumPy’s median.
grouped_data['rt'].median().reset_index()
grouped_data['rt'].aggregate(np.median).reset_index()Code language: Python (python)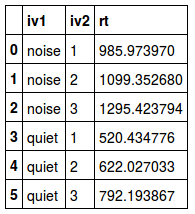
Scipy Mode
In this section of the descriptive statistics in Python tutorial, we will use SciPy to get the mode. Now, there is a method (i.e., pandas.DataFrame.mode()) to get the mode of a DataFrame. However, in this example, we will use SciPy’s mode because Pandas’ mode cannot be used on grouped data.
grouped_data['rt'].apply(mode, axis=None).reset_index()Code language: Python (python)Most of the time, we would probably want to see all measures of central tendency at the same time. Luckily, the aggregate method lets us use many NumPy and SciPy methods. In the example below, the standard deviation (std), mean, harmonic mean, geometric mean, and trimmed mean are all in the same output. Note that we will have to add the trimmed means afterwards.
descr = grouped_data['rt'].aggregate([np.median, np.std, np.mean]).reset_index()
descr['trimmed_mean'] = pd.Series(trimmed_mean.values, index=descr.index)
descrCode language: Python (python)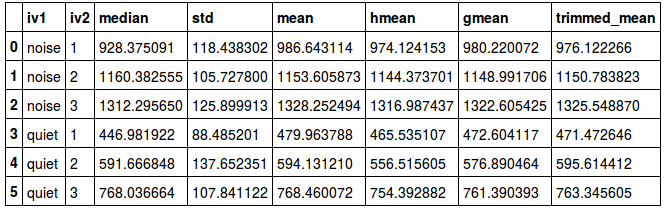
Measures of Variability in Python
In this section of the summary statistics in Python post, we will continue and learn how to calculate measures of variability in Python. Now, central tendency (e.g., the mean & median) is not the only summary statistic we want to calculate. We will probably also want to look at a measure of the data’s variability.
Pandas Standard Deviation
Here is how to calculate the standard deviation in Python with Pandas:
grouped_data['rt'].std().reset_index()Code language: Python (python)Interquartile Range in Pandas
In this example, we will use Pandas quantile to calculate the IQR. Note that here we use unstack()` also get the quantiles as columns, and the output is easier to read.
grouped_data['rt'].quantile([.25, .5, .75]).unstack()Code language: Python (python)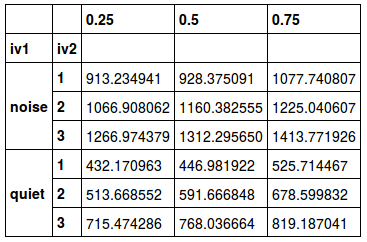
Pandas Variance
Variance is easy to calculate using Pandas. In the example below, we use the var method to carry out the calculation together with the reset_index method.
grouped_data['rt'].var().reset_index()Code language: Python (python)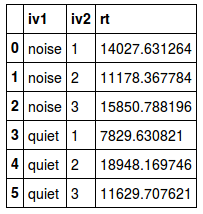
Saving Summary Statistics to a CSV
If we want to save our descriptive statistics, calculated in Python, we can use the Pandas dataframe to_csv method. In the example below, we are saving the Pandas dataframe descr created earlier to a CSV file:
descr.to_csv('Descriptive_Statistics_in_Python.csv', index=False)Code language: Python (python)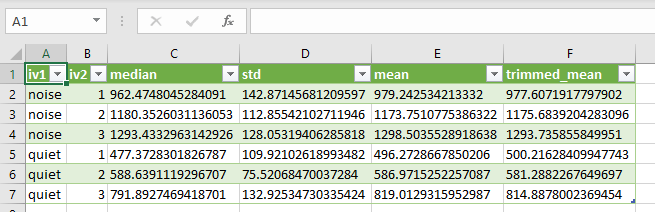
Finally, if we save many CSV files using Pandas and descriptive statistics from different datasets, we may, in the future, also learn how to rename a file in Python.
Conclusion
That is all. Now you know how to obtain some of the most common descriptive statistics using Python. Pandas, NumPy, and SciPy really makes these calculation almost as easy as doing it in graphical statistical software such as SPSS. One great advantage of the apply and aggregate methods is that we can apply other methods or functions to obtain other types of descriptives.
Here’s a Jupyter Notebook with all the examples above.
Update: Recently, I learned some methods to explore response times by visualising the distribution of different conditions: Exploring response time distributions using Python.
I am sorry that the images (i.e., the tables) are so ugly. If you happen to know a good way to output tables and figures from Python (something like Knitr & Rmarkdown) please let me know.