In this Pandas tutorial, you will learn how to count occurrences in a column. There are occasions in data science when you need to know how many times a given value occurs. This can happen when you, for example, have a limited set of possible values you want to compare. Another example can be if you want to count the number of duplicate values in a column. Furthermore, we may want to count the number of observations there is in a factor, or we need to know how many men or women there are in the data set, for example.
Table of Contents
- Outline
- Importing the Packages and Data
- How to Count Occurences in a Column with Pandas value_counts()
- Pandas Count Unique Values and Missing Values in a Column
- Getting the Relative Frequencies of the Unique Values
- Creating Bins when Counting Distinct Values
- Count the Frequency of Occurrences Across Multiple Columns
- Counting the Occurrences of a Specific Value in Pandas Dataframe
- Counting the Frequency of Occurrences in a Column using Pandas groupby Method
- Conclusion: Pandas Count Occurences in Column
- Resources
Outline
In this post, you will learn how to use Pandas value_counts() method to count the occurrences in a column in the dataframe. First, we start by importing the needed packages and then import example data from a CSV file. Second, we will start looking at the value_counts() method and how we can use this to count distinct occurrences in a column. Third, we will count the number of occurrences of a specific value in the dataframe. In the last section, we will have a look at an alternative method that also can be used: the groupby() method together with size() and count(). Let us start by importing Pandas and some example data to play around with!
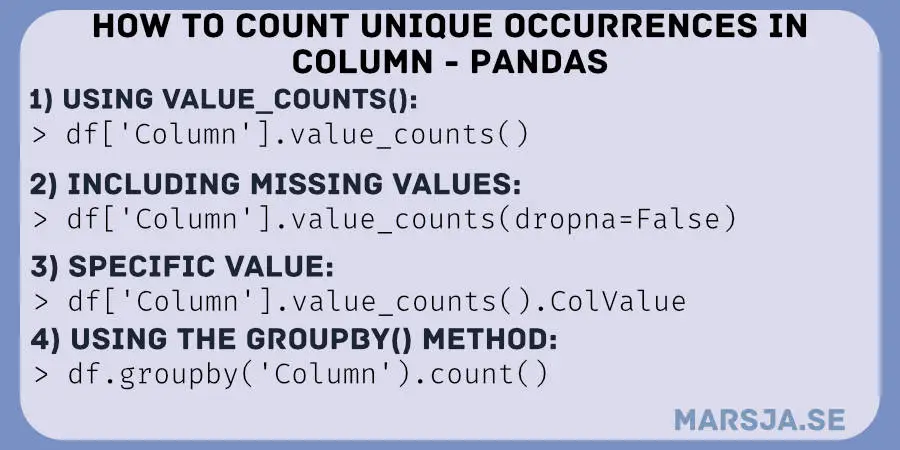
To count the number of occurrences in, e.g., a column in a dataframe you can use Pandas value_counts() method. For example, if you type df['condition'].value_counts() you will get the frequency of each unique value in the column “condition”.
Before we use Pandas to count occurrences in a column, we will import some data from a .csv file.
Importing the Packages and Data
We use Pandas read_csv to import data from a CSV file found online:
import pandas as pd
# URL to .csv file
data_url = 'https://vincentarelbundock.github.io/Rdatasets/csv/carData/Arrests.csv'
# Reading the data
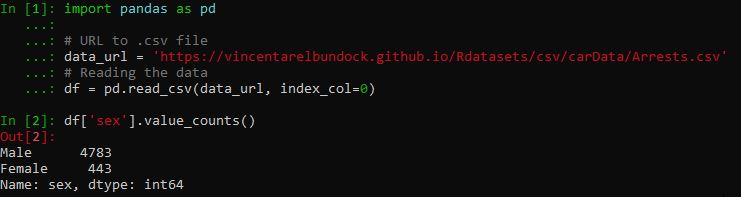
df = pd.read_csv(data_url, index_col=0)Code language: Python (python)In the code example above, we first imported Pandas and then created a string variable with the URL to the dataset. In the last line of code, we imported the data and named the dataframe “df”. Note, we used the index_col parameter to set the first column in the .csv file as index column. Briefly explained, each row in this dataset includes details of a person arrested. This means, and is true in many cases, that each row is one observation in the study. If you store data in other formats, refer to the following tutorials:
- How to Read SAS Files in Python with Pandas
- Pandas Excel Tutorial: How to Read and Write Excel files
- How to Read & Write SPSS Files in Python using Pandas
- How to Read SAS Files in Python with Pandas
In this tutorial, we are mainly going to work with the “sex” and “age” columns. It may be obvious but the “sex” column classifies an individual’s gender as male or female. The age is, obviously, referring to a person’s age in the dataset. We can take a quick peek of the dataframe before counting the values in the chosen columns:
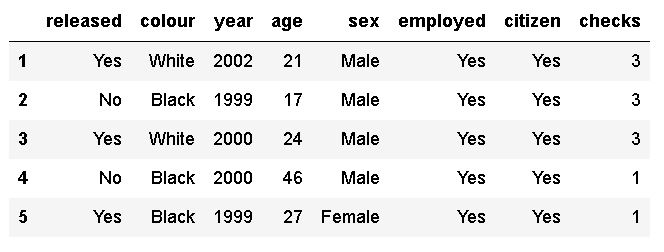
If you have another data source and you can also add a new column to the dataframe. Although, we get some information about the dataframe using the head() method, you can get a list of column names using the column() method. Many times, we only need to know the column names when counting values. Note, if needed you can also use Pandas to rename a column in the dataframe.
Of course, in most cases, you would count occurrences in your own data set, but now we have data to practice counting unique values with. In fact, we will now jump right into counting distinct values in the column “sex”. That said, we are ready to use Pandas to count occurrences in a column, in our dataset.
How to Count Occurences in a Column with Pandas value_counts()
Here is how to count occurrences (unique values) in a column in Pandas dataframe:
# pandas count distinct values in column
df['sex'].value_counts()Code language: Python (python)
As you can see, we selected the column “sex” using brackets (i.e. df['sex']), and then we just used the value_counts() method. Note, if we want to store the counted values as a variable we can create a new variable. For example, gender_counted = df['sex'].value_counts() would enable us to fetch the number of men in the dataset by its index (0, in this case).
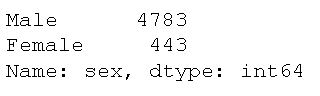
As you can see, the method returns the count of all unique values in the given column in descending order, without any null values. By glancing at the above output we can, furthermore, see that there are more men than women in the dataset. In fact, the results show us that the vast majority are men.
Now, as with many Pandas methods, value_counts() has a couple of parameters that we may find useful at times. For example, if we want the reorder the output such so that the counted values (male and female, in this case) are shown in alphabetical order, we can use the ascending parameter and set it to True:
# pandas count unique values ascending:
df['sex'].value_counts(ascending=True)Code language: Python (python)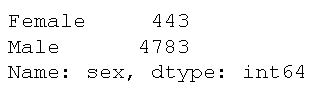
Note both of the examples above will drop missing values. That is, they will not be counted at all. There are cases, however, when we may want to know how many missing values there are in a column as well. In the next section, we will therefore have a look at another parameter that we can use (i.e., dropna). First, however, we need to add a couple of missing values to the dataset:
import numpy as np

# Copying the dataframe
df_na = df

# Adding 10 missing values to the dataset
df_na.iloc[[1, 6, 7, 8, 33,
            44, 99, 103, 109, 201], 4] = np.NaNCode language: Python (python)
In the code above, we used Pandas iloc method to select rows and NumPy’s nan to add the missing values to these rows that we selected. In the next section, we will count the occurrences, including the 10 missing values we added above.
Pandas Count Unique Values and Missing Values in a Column
Here is a code example to get the number of unique values as well as how many missing values there are:
# Counting occurences as well as missing values:
df_na['sex'].value_counts(dropna=False)Code language: Python (python)
Looking at the output, we can see that there are ten missing values (yes, yes, we already knew that!).
Getting the Relative Frequencies of the Unique Values
Now that we have counted the unique values in a column, we will continue by using another parameter of the value_counts() method: normalize. Here’s how we get the relative frequencies of men and women in the dataset:
df['sex'].value_counts(normalize=True)Code language: Python (python)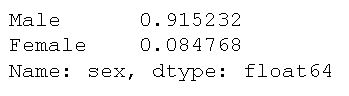
This may be useful if we not only want to count the occurrences but want to know e.g. what percentage of the sample that are male and female. Before moving on to the next section, let’s get some descriptive statistics of the age column by using the describe() method:
df['age'].describe()Code language: Python (python)Naturally, counting age as we did earlier, with the column containing gender, would not provide any useful information. Here’s the data output from the above code:
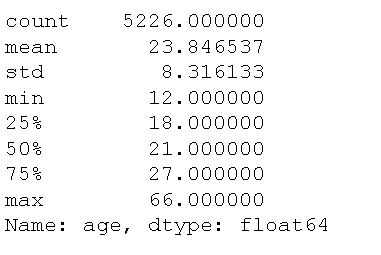
We can see that there are 5226 values of age data, a mean of 23.85, and a standard deviation of 8.32. Naturally, counting the unique values of the age column would produce a lot of headaches but, of course, it could be worse. In the next example, we will look at counting age and how we can bin the data. This is useful if we want to count e.g. continuous data.
Creating Bins when Counting Distinct Values
Another cool feature of the value_counts() method is that we can use the method to bin continuous data into discrete intervals. Here’s how we set the parameter bins to an integer representing the number of bins to create bins:
# pandas count unique values in bins:
df['age'].value_counts(bins=5)Code language: Python (python)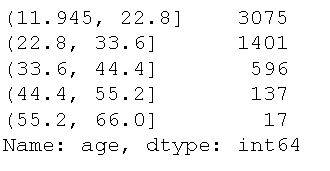
For each bin, the range of age values (in years, naturally) is the same. One contains ages from 11.45 to 22.80 which is a range of 10.855. The next bin, on the other hand, contains ages from 22.80 to 33.60, which is a range of 11.8. in this example, you can see that all ranges here are roughly the same (except the first, of course). However, each range of age values can contain a different count of the number of persons within this age range. We can see that most arrested people are under 22.8, followed by under 33.6. It makes sense, in this case, right? In the next section, we will have a look at how we can use count the unique values in all columns in a dataframe.
Count the Frequency of Occurrences Across Multiple Columns
Naturally, it is also possible to count the occurrences in many columns using the value_counts() method. Now, we are going to start by creating a dataframe from a dictionary:
# create a dict of lists
data = {'Language':['Python', 'Python',
                   'Javascript',
                   'C#', 'PHP'],
       'University':['LiU', 'LiU',
              'UmU', 'GU','UmU'],
       'Age':[22, 22, 23, 24, 23]}

# Creating a dataframe from the dict
df3 = pd.DataFrame(data)

df3.head()Code language: Python (python)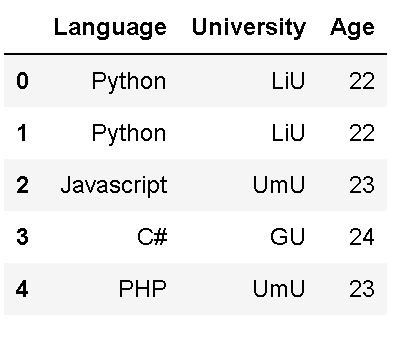
As you can see in the output, above, we have a smaller data set which makes it easier to show how to count the frequency of unique values in all columns. If you need, you can convert a NumPy array to a Pandas dataframe, as well. That said, here’s how to use the apply() method:
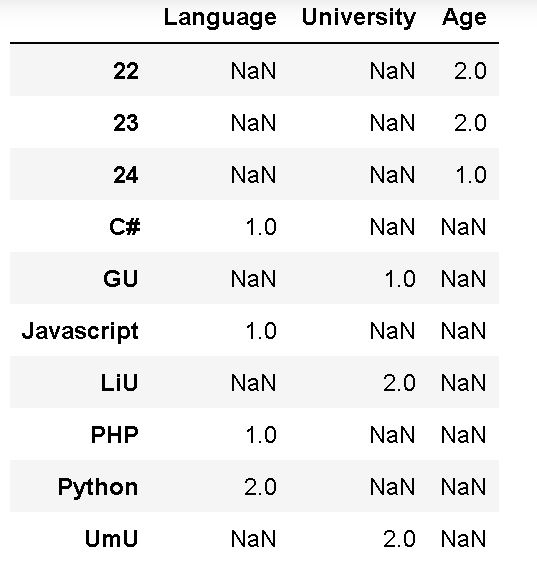
df3.apply(pd.value_counts)Code language: Python (python)What we did, in the code example above, was to use the method with the value_counts method as the only parameter. This will apply this method to all columns in the Pandas dataframe. However, this really not a feasible approach if we have larger datasets. In fact, the unique counts we get for this rather small dataset is not that readable:
Counting the Occurrences of a Specific Value in Pandas Dataframe
It is, of course, also possible to get the number of times a certain value appears in a column. Here’s how to use Pandas value_counts(), again, to count the occurrences of a specific value in a column:
# Count occurences of certain value (i.e. Male) in a column (i.e., sex)
df.sex.value_counts().MaleCode language: Python (python)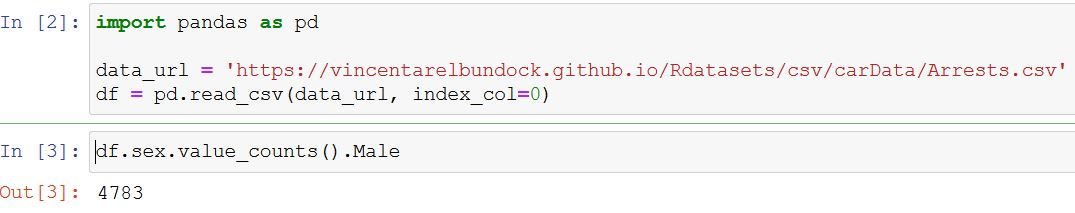
In the example above, we used the dataset we imported in the first code chunk (i.e., Arrest.csv). Furthermore, we selected the column containing gender and used the value_counts() method. Because we wanted to count the occurrences of a certain value we then selected Male. The output shows us 4783 occurrences of this certain value in the column.
As often, when working with programming languages, there are more approaches than one to solve a problem. Therefore, in the next example, we are going to have a look at some alternative methods that involve grouping the data by category using Pandas groupby() method.
Counting the Frequency of Occurrences in a Column using Pandas groupby Method
In this section, we are going to learn how to count the frequency of occurrences across different groups. For example, we can use size() to count the number of occurrences in a column:
# count unique values with pandas size:
df.groupby('sex').size()Code language: Python (python)
Another method to get the frequency we can use is the count() method:
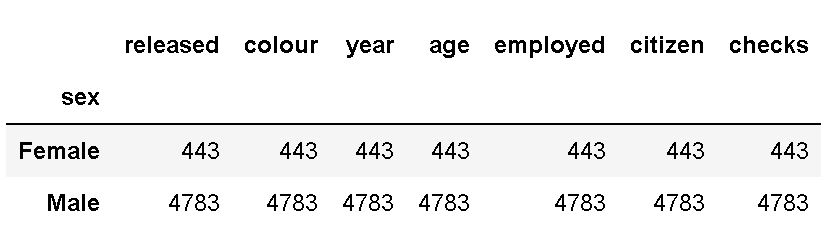
# counting unique values with pandas groupby and count:
df.groupby('sex').count()Code language: Python (python)
Now, in both examples above, we used the brackets to select the column we want to apply the method on. Just as in the value_counts() examples we saw earlier. Note that this produces the exact same output as using the previous method and to keep your code clean I suggest that you use value_counts(). Finally, it is also worth mentioning that using the count() method will produce unique counts, grouped, for each column. This is clearly redundant information:
Conclusion: Pandas Count Occurences in Column
In this post, we have explored various techniques for counting occurrences in a Pandas dataframe. We started by importing the necessary packages and data, setting the foundation for our analysis. Using the value_counts() method, we obtained the counts of unique values in a specific column, providing valuable insights into the data distribution.
We also learned about counting unique and missing values in a column, allowing us to understand the data’s uniqueness and completeness better. By calculating relative frequencies, we determined the proportion of each unique value in the column, providing valuable context for analysis.
We also discussed creating bins to group distinct values, enabling us to analyze data in a more aggregated form. Furthermore, we explored counting occurrences across multiple columns, allowing us to gain insights into the relationships between different variables.
To provide even more flexibility in our analysis, we discussed how to count the occurrences of a specific value in a Pandas dataframe, giving us a targeted view of the data. Additionally, we learned how to use the groupby method to count the frequency of occurrences in a column, facilitating analysis based on different groups or categories.
These techniques can effectively count occurrences in your data, find patterns, and draw meaningful conclusion. Whether exploring datasets, performing data cleaning, or conducting statistical analysis, understanding how to count occurrences is valuable in data manipulation and interpretation.
I hope this post has equipped you with the knowledge and tools necessary to count occurrences confidently in a Pandas dataframe. Remember to share it on your social media accounts.
Resources
Here are some Python and Pandas tutorials on this site that you might find helpful:
- Coefficient of Variation in Python with Pandas & NumPy
- Python Scientific Notation & How to Suppress it in Pandas & NumPy
- Pandas Count Occurrences in Column – i.e. Unique Values
- Python Check if File is Empty: Data Integrity with OS Module
- Your Guide to Reading Excel (xlsx) Files in Python