Sometimes, when we use data frames in R, we need to remove rows with specific values. For example, we might want to exclude rows that have missing values, outliers, or errors. Or we might want to subset our data based on some criteria, such as a range of values, a category, or a pattern. In this blog post, we will learn how to use the dplyr package in R to remove rows with certain values from a dataframe, and provide four examples of different scenarios.
Table of Contents
- Outline
- dplyr
- Example 1: Use R to Remove rows with Certain Values (Missing)
- Example 2: Use R to Remove Rows with Certain Values that are Extreme
- Example 3: R Remove Rows with Specific Values with dplyr
- Example 4: Remove Rows with Certain Values with dplyr following a Pattern
- Conclusion
- Resources
Outline
The structure of the post is as follows: First, it starts with a brief discussion on dplyr. Following this introduction, we go into four examples demonstrating how to effectively remove rows with specific values using dplyr. The examples cover scenarios such as removing missing values, extreme values, and rows following a specific pattern. Detailed explanations and code snippets for implementation accompany each example. Finally, we summarize key insights gained from the examples and highlight the versatility of dplyr for data-cleaning tasks.
Here are some other posts about working with rows:
- How to Remove/Delete a Row in R – Rows with NA, Conditions, Duplicated
- How to Sum Rows in R: Master Summing Specific Rows with dplyr
- Remove Specific Row in R: How to & Examples with dplyr
dplyr
The dplyr package is a popular and powerful tool for data manipulation and analysis in R. It provides a consistent and intuitive syntax for working with data frames, using verbs such as select, filter, mutate, arrange, and summarize. One of the most useful verbs in dplyr is filter, which allows us to subset a dataframe based on logical conditions. We can use filter to remove rows with certain values by specifying the conditions we want to keep, and the rows that do not match those conditions will be dropped. Here is the general syntax of filter:
filter(data, condition1, condition2, ...)where data is the name of your data frame, and condition1, condition2, … are the logical expressions that define the rows you want to keep. We can use any logical operators, such as ==, !=, <, >, <=, >=, %in%, and !%in%, and combine them with & (and), | (or), and ! (not). Moreover, we can use functions that return logical values, such as is.na, is.null, grepl, and str_detect. Here are some posts about some of the above-mentioned operators:
- Master or in R: A Comprehensive Guide to the Operator
- How to use %in% in R: 8 Example Uses of the Operator
Let us look at some examples of how to use a filter to remove rows with certain values from a dataframe. We will use the mtcars data set, which is built into R and contains information about 32 cars, such as miles per gallon, number of cylinders, horsepower, and weight.
Example 1: Use R to Remove rows with Certain Values (Missing)
One of the most common data-cleaning tasks is dealing with missing values. Missing values can cause problems in data analysis, such as bias, error, or reduced efficiency. One way to handle missing values is to remove the rows that contain them, which can be done with filter and the is.na function. For example, suppose we have a data frame called cars, which is a modified version of mtcars with some missing values introduced:
cars <- mtcars
cars[c(1, 5, 10, 15, 20, 25, 30), "mpg"] <- NA
cars[c(2, 6, 11, 16, 21, 26, 31), "cyl"] <- NA
cars[c(3, 7, 12, 17, 22, 27, 32), "hp"] <- NACode language: R (r)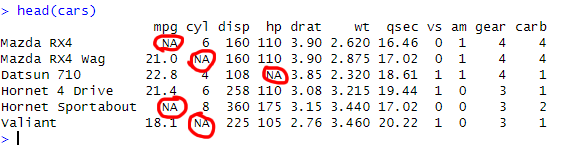
We can use the filter and is.na functions to remove the rows that have missing values in any of the columns:
library(dplyr)
cars %>% filter(!is.na(mpg),
                !is.na(cyl),
                !is.na(hp))Code language: CSS (css)
In the code chunk above, we used the ! operator to negate the is.na function. This means we want to keep the rows that are not missing. We also use the %>% operator, called the pipe operator, to chain the filter function to the data frame. This makes the code more readable and concise. The output is a data frame with 11 rows and 11 columns, where all the missing values have been removed.
Example 2: Use R to Remove Rows with Certain Values that are Extreme
Another common task in data cleaning is to deal with outliers. Outliers are values that are unusually high or low compared to the rest of the data. Here is another example when we may want to use R to remove rows with certain values with dplyr: the extreme ones. Outlier values can, namely, distort the results of data analysis, such as mean, standard deviation, correlation, and regression. One way to handle outliers is to remove the rows that contain them, which can be done with filter and some criteria to identify the outliers. For example, suppose we want to remove the rows from the mtcars data set with miles per gallon (mpg) values more than three standard deviations away from the mean. We can use filter and the mean and sd functions to do that:
library(dplyr)
mtcars %>% filter(mpg > mean(mpg) - 2 * sd(mpg) &
                  mpg < mean(mpg) + 2 * sd(mpg))
In the code chunk above, we used R to remove certain values (outliers) with dplyr. We successfully did this using filter(). Note that we also used he mean and sd functions to calculate the mean and standard deviation of the mpg column, and then used them to define the upper and lower limits of the acceptable range. We also use the & operator to combine the two conditions, which means we want to keep the rows that satisfy both of them.
Example 3: R Remove Rows with Specific Values with dplyr
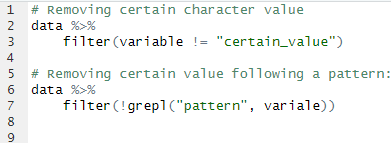
Sometimes, we might want to remove the rows with certain values that you are not interested in, or that are irrelevant or erroneous. For example, suppose we want to remove the rows from the mtcars data set that have 4 cylinders, because we are only interested in the cars that have 6 or 8 cylinders. We can use filter and the != operator to do that:
library(dplyr)
mtcars %>% filter(cyl != 4)Code language: R (r)
The output is a data frame with 21 rows and 11 columns, where the rows that had 4 cylinders have been removed. In the code chunk above, we used the != operator to indicate that we want to keep the rows that are not equal to 4.
Example 4: Remove Rows with Certain Values with dplyr following a Pattern
Finally, you might want to remove the rows that have a value that matches a certain pattern, such as a word, a letter, or a symbol. For example, suppose we have a data frame called fruits, which contains the names and prices of some fruits:
fruits <- data.frame(
name = c("apple", "banana", "cherry", "date", "elderberry", "fig", "grape"),
price = c("$1.00", "$0.50", "$2.00", "$3.00", "Missing", "$4.00", "$1.50")
)Code language: R (r)
Again, we can use filter but this time with the str_detect function from the stringr package to remove the rows that have certain values. In this case, the values indicated by the “Missing” value:
library(dplyr)
library(stringr)
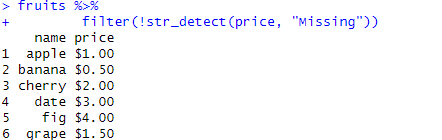
fruits <- fruits %>%
filter(!str_detect(price, "Missing"))Code language: R (r)In the code chunk above, we used the str_detect function to check if the price column contains the “Missing” pattern, and then use the ! operator to negate it, which means we want to keep the rows that do not contain the pattern. This code can be adapted to other examples (i.e., other string patterns in our data). The output is a data frame with 6 rows and 2 columns, where the row that had a missing price has been removed:
Here are two more examples:
Note that to save the changes we need to assign the dataframe (e.g., by using <-):
fruits <- fruits %>%
    filter(!str_detect(Price, "Missing"))
Code language: R (r)
Conclusion
In this post, we have learned how to use the dplyr package in R to remove rows with certain values from a data frame. The dplyr package is a popular and powerful tool for data manipulation and analysis in R. It provides a set of consistent and expressive verbs that make it easy to perform common operations on data frames. One of these verbs is filter, which allows us to select a subset of rows based on some criteria. We have seen how to use filter with logical operators, regular expressions, and negation to remove rows that contain missing values, specific words, or patterns. By using filter, we can clean and prepare our data for further analysis or visualization.
I hope you have enjoyed this tutorial and found it useful. Please comment below or email me if you have any questions or feedback. Also, if you liked this post, do not forget to share it on social media. Thanks for reading!
Resources
Here are some other blog posts focusing on dplyr:
- How to Standardize Data in R with scale() & dplyr
- Convert Multiple Columns to Numeric in R with dplyr
- How to Convert a List to a Dataframe in R – dplyr
- Countif function in R with Base and dplyr