In this post, we will learn how to sum rows in R, explore some techniques to calculate row-wise totals, and use both base R and the dplyr package. Similar to an earlier post discussing summing columns in R, we will now learn row-wise summations. First, we will use base functions like rowSums() and apply() to perform row-wise calculations. Here is a basic example of calculating the row sum in R: rowSums(dataframe).
We will also look at how to sum specific rows based on conditions, a key skill in data manipulation. This approach is essential when you want to aggregate values selectively, catering to various data analysis needs. Psychology, hearing science, and data science are domains where such techniques can aid us in finding meaningful patterns in research or survey data.
Expanding our capabilities, we will further utilize dplyr to sum rows in R, leveraging functions like mutate() and summarize(). This approach is highly efficient for larger datasets and complex calculations. The flexibility of dplyr allows us to integrate row-wise summation into data manipulation pipelines seamlessly.
In this post, we will use the functions rowSums(), apply(), mutate(), and summarize() to name a few. Whether you’re working with survey data, analyzing experimental results, or performing data science tasks, the ability to sum rows across various contexts is a valuable skill.
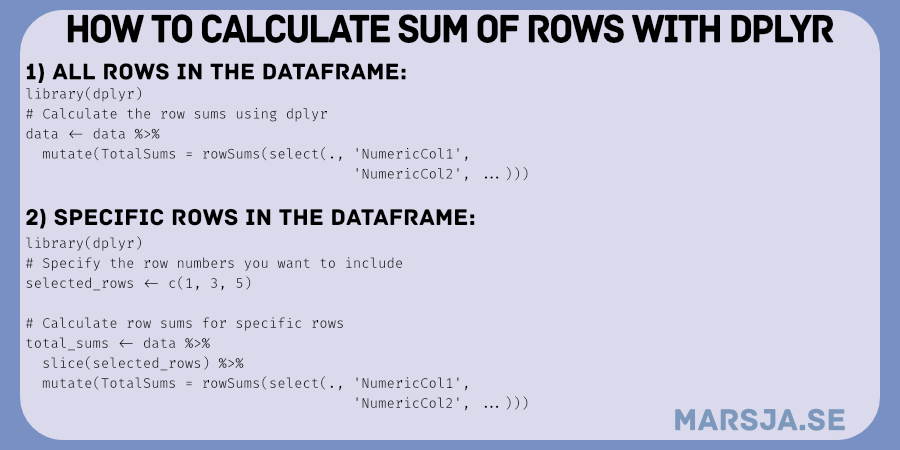
Table of Contents
- Outline
- Prerequisites
- Synthetic Data
- How to Sum Rows in R with rowSums()
- How to Sum Specific Rows in R
- How to Calculate Row Sums in R using dplyr
- How to Calculate Row Sums for Specific Rows with dplyr
- Calculating the Row Sums in R for all Numeric Columns
- Conclusion: How to Sum Rows in R
- Resources
Outline
The outline of the current post is as follows: we will learn how to sum rows in R using different techniques and tools efficiently. First, we will explore rowSums() to calculate row sums.
Next, we will look at more advanced scenarios by demonstrating how to sum specific rows based on row numbers and conditions. These examples will showcase practical applications of row summing. In the subsequent sections, we will use the dplyr package, a versatile tool for data manipulation. We will showcase how to use dplyr to calculate row sums for specific rows and across entire numeric columns.
To put these concepts into context, we will provide examples. In Example 1, we will explore how to sum specific rows based on row numbers, enabling precise control over the rows included in the calculations. In Example 2, we will demonstrate how to conditionally sum specific rows, a technique particularly useful for targeted analyses.
Finally, we will dive deeper into the dplyr approach, applying row sum calculations across specific rows within groups (same examples as earlier). Finally, we will see how to calculate the row sums for all numeric columns in a dataset using the dplyr package.
Prerequisites
A foundational understanding of R programming is needed to make the most of this post’s content. Basic familiarity with R’s syntax and core concepts will enable you to grasp and apply the techniques demonstrated.
If you plan to harness the capabilities of the dplyr package – a robust tool for data manipulation – you must install it. You can easily install dplyr by executing the command install.packages("dplyr"), or you might consider installing the comprehensive tidyverse package, which encompasses dplyr and a range of other valuable components.
With the power of dplyr, you can perform operations such as renaming a column, counting the number of occurrences in a column, and summing across columns – all crucial skills in data analysis.
Moreover, checking your R version in RStudio is easy. To do this, run the command R.version$version.string within the R console. Staying up-to-date with your R version is important; it ensures access to the latest features, enhancements, and bug fixes. This practice is particularly significant when working with packages like dplyr, that continually evolve to deliver improved functionality and user experience. If you need to update R, you can conveniently execute installr::updateR().
Synthetic Data
Here is a synthetic dataset we will use to practice summing across rows in R:
# Set seed for reproducibility
set.seed(230812)

# Generate synthetic data
n <- 100  # Number of observations

# Generate PTA values
pta <- sample(10:25, n, replace = TRUE)
pta_impairment <- sample(26:30, n, replace = TRUE)

# Generate WMC values
wmc <- sample(80:100, n, replace = TRUE)

# Generate hearing status (Normal or Impaired)
hearing_status <- rep(c("Normal", "Impaired"), each = n/2)

# Generate signal-to-noise ratio
snr_normal <- rnorm(n, mean = -8, sd = 2)
snr_impairment <- rnorm(n, mean = -6, sd = 2)

# Create the synthetic dataset
synthetic_data <- data.frame(PTA = c(pta, pta_impairment),
                             WMC = wmc,
                             HearingStatus = rep(hearing_status, times = 2),
                             SNR = c(snr_normal, snr_impairment))

# Display the first few rows of the synthetic dataset
head(synthetic_data)Code language: PHP (php)
In the code chunk above, we ensured reproducibility by setting the seed using set.seed(123). This step guarantees consistent random data generation across different runs of the code.
Next, we created a synthetic dataset to explore summing rows in R. We use the sample() function to generate values for the Pure-Tone Average (PTA) column, simulating hearing measurements. The function generated a sequence of values within the 10 to 25 dB range, reflecting PTA values for individuals with varying hearing levels. Similarly, we again employed the sample() function to generate Working Memory Capacity (WMC) values ranging from 80 to 100.
The rep() function helped us create the Hearing Status column, alternating between “Normal” and “Impaired” labels for each set of observations.Furthermore, we used the rnorm() function to simulate the Signal-to-Noise Ratio (SNR) column. The function generates random numbers with a mean of -8 for individuals with normal hearing and a mean of -6 for those with impaired hearing.
This code chunk establishes a synthetic dataset with columns mimicking hearing-related measurements and attributes. The created dataset is poised for further exploration, including summing rows, analyzing specific rows, and potentially grouping data based on hearing status or other factors of interest.
How to Sum Rows in R with rowSums()
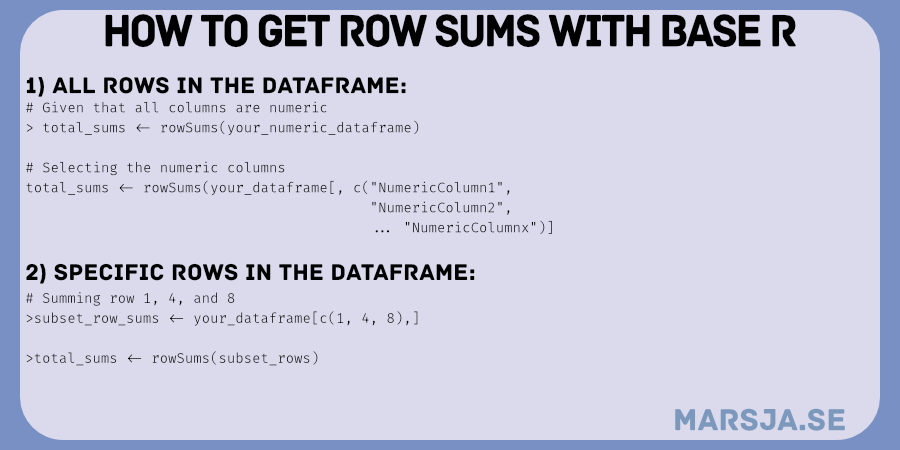
Here is how to calculate the row sum in R:
# Calculate the row sums
total_sums <- rowSums(synthetic_data[, c("PTA", "WMC", "SNR")])Code language: PHP (php)
In the code snippet above, we performed row-wise summation of specific columns in the synthetic_data dataframe using the rowSums() function. We specify the columns for summation as “PTA,” “WMC,” and “SNR” using the indexing notation [, c("PTA", "WMC", "SNR")].
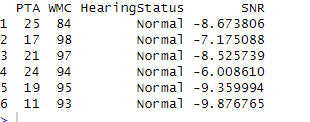
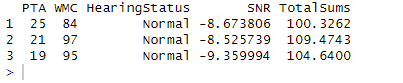
Next, we add a new column to the R dataframe. We called this column TotalSums and used the $ operator. Finally, we assigned the previously calculated total_sums to this new column, effectively incorporating the row-wise sums into our dataset. Here is the new column with the summed rows:
How to Sum Specific Rows in R
In this section, we will learn summing specific rows
Example 1: Summing Specific Row Numbers
We can select rows in R and calculate the row sum of these columns:
# Select specific rows by row numbers
specific_rows <- synthetic_data[c(2, 4, 6), ]

# Calculate the row sums for the selected rows
specific_rows_sums <- rowSums(specific_rows[, c("PTA", "WMC", "SNR")])

# Add a column to the selected rows dataframe
specific_rows$RowSums <- specific_rows_sumsCode language: PHP (php)
In the code snippet above, we selected specific rows from the dataframe using row numbers. Next, we calculated the row sums for the selected rows using the rowSums() function, focusing on the columns “PTA,” “WMC,” and “SNR.”
Finally, we utilized the $ operator to add a new column named RowSums to the `specific_rows dataframe. This column stores the calculated row sums for the specified rows. This approach allows us to easily calculate specific rows of interest within our dataset. The following section will demonstrate how to calculate row sums in R by selecting rows based on specific conditions.
Example 2: Conditionally Summing Specific Rows
Calculating row sums in R using specific rows based on conditions is also possible. Here is an example where we sum the values for individuals with mild hearing loss (PTA between 26 and 30 dB) and working memory capacity (WMC) above 80.
# Subset the dataframe based on specific conditions
subset_data <- synthetic_data[(synthetic_data$PTA >= 26 & synthetic_data$PTA <= 30) &
                               synthetic_data$WMC > 80, ]

# Calculate the row sums for the subset
specific_sums <- rowSums(subset_data[, c("PTA", "WMC", "SNR")])

# Add a column to the subset dataframe
subset_data$SpecificSums <- specific_sums
Code language: PHP (php)
In the code chunk above, we started by subsetting the synthetic_data dataframe based on specific conditions using logical operators (>=, <=, &, and >). We created a new dataframe called subset_data containing rows that meet our criteria for mild hearing loss and high WMC.
Next, we calculated the row sums for the selected columns (“PTA,” “WMC,” and “SNR”) within the subset_data dataframe using the rowSums() function.
Finally, we used the $ operator to add a new column named SpecificSums to the subset_data dataframe, which holds the calculated row sums for the specified conditions. In the following sections, we will use dplyr to do the same operations.
How to Calculate Row Sums in R using dplyr
Here is how we can calculate the sum of rows using the R package dplyr:
library(dplyr)

# Calculate the row sums using dplyr
synthetic_data <- synthetic_data %>%
  mutate(TotalSums = rowSums(select(., PTA, WMC, SNR)))Code language: PHP (php)
In the code snippet above, we loaded the dplyr library. We then used the %>% pipe operator to apply operations to the synthetic_data dataframe. Within the mutate() function, we created a new column called TotalSums using the rowSums() function. The select() function is used to select the columns by their names (i.e., “PTA,” “WMC,” and “SNR”). This approach demonstrates how we can efficiently use dplyr to perform row-wise calculations and add new columns to a dataframe concisely and expressively.
How to Calculate Row Sums for Specific Rows with dplyr
Here are two examples of how to sum across specific columns in R using dplyr:
Example 1: Sum Across Specific Rows
Here is how to select specific row numbers and calculate the row sums for these:
library(dplyr)

# Specify the row numbers you want to include
selected_rows <- c(1, 3, 5)

# Calculate row sums for specific rows
specific_row_sums <- synthetic_data %>%
  slice(selected_rows) %>%
  mutate(TotalSums = rowSums(select(., PTA, WMC, SNR)))

# Display the result
print(specific_row_sums)Code language: R (r)
In the code chunk above, we focus on two primary functions from the dplyr package to calculate row sums for specific rows in R. First, we used the slice() function to subset the data based on specified row numbers defined in the selected_rows vector. This effectively selects the rows with indices 1, 3, and 5 from the dataset.
Next, we chained the %>% operator to transition into the mutate()function, like in the previous example. Within mutate(), we calculated the row sums for the selected rows. Again, we use the rowSums() function. The select() function is used to specify the columns (PTA, WMC, and SNR). Importantly, if your data contains missing values, add na.rm = TRUE to the rowSums() function.
Example 2: Sum Across Rows Conditionally
We can also use dplyr and the filter() function to sum rows in R with conditions:
library(dplyr)

# Define the condition
condition <- synthetic_data$PTA < 20

# Calculate row sums for rows that meet the condition
condition_row_sums <- synthetic_data %>%
  filter(condition) %>%
  mutate(TotalSums = rowSums(select(., PTA, WMC, SNR)))Code language: PHP (php)
In the code snippet above, we began by loading the dplyr package to enable data manipulation. We then defined a condition based on the PTA column in the synthetic_data dataframe where values are less than 20. Moreover, we applied a series of operations using the %>% pipe operator. We used the filter() function to select rows that meet the specified condition. Then, we used mutate() to calculate row sums for specific columns (PTA, WMC, SNR) and created a new column named TotalSums.
Calculating the Row Sums in R for all Numeric Columns
In the previous examples, we selected specific columns by name to compute row sums. However, dplyr provides helpful functions that simplify the process of applying a calculation to all numeric columns.
Here is code demonstrating this with the synthetic dataset:
library(dplyr)

# Calculate row sums for all numeric columns
all_numeric_sums <- synthetic_data %>%
  mutate(TotalSums = rowSums(select(., where(is.numeric))))Code language: R (r)
In the code snippet above, we utilize the select() function and the where() function to exclusively target all numeric columns within the dataset. We ensure that only numerical data is included by employing the is.numeric condition. Subsequently, the rowSums() function computes the sum for each row across these numeric columns. This strategic approach enables row sum calculations in R explicitly tailored for the numeric data within the dataset.
Conclusion: How to Sum Rows in R
In this post, we have explored some techniques for calculating row sums in R. We began by using the rowSums() function to sum across rows, a good skill for aggregating data and gaining valuable insights. Through practical examples, we learned how to sum specific rows, whether based on row numbers or specified conditions, using both base R and the powerful dplyr package.
We also used dplyr functions such as select() and mutate(), enabling us to calculate row sums efficiently and flexibly.
Please share this post on social media or leave your thoughts in the comments below to exchange insights or suggest topics for future posts.
Resources
Here is a range of different tutorials that you may find helpful:
- How to Create a Word Cloud in R
- Coefficient of Variation in R
- How to Take Absolute Value in R – vector, matrix, & data frame
- How to Standardize Data in R
- Modulo in R: Practical Example using the %% Operator
- How to Calculate Descriptive Statistics in R the Easy Way with dplyr
- How to Check if a File is Empty in R: Practical Examples