In this Pandas tutorial, we will go through the steps of how to use Pandas read_html method for scraping data from HTML tables. First, in the simplest example, we are going to use Pandas to read HTML from a string. Second, we will go through a couple of examples in which we scrape data from Wikipedia tables with Pandas read_html. In a previous post, about exploratory data analysis in Python, we also used Pandas to read data from HTML tables.
Table of Contents
- Import Data in Python
- Prerequisites
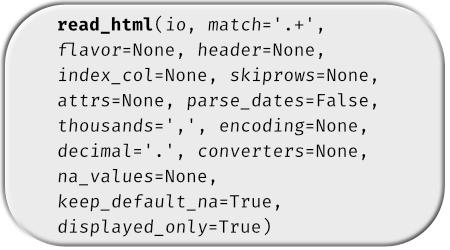
- Pandas read_html Syntax
- Pandas read_html Example 1:
- Pandas read_html Example 2:
- Pandas read_html Example 3:
- Conclusion: How to Read HTML to a Pandas DataFrame
Import Data in Python
When starting off learning Python and Pandas, for data analysis and visualization, we usually start practicing importing data. In previous posts, we have learned that we can type in values directly in Python (e.g., creating a Pandas dataframe from a Python dictionary or converting a NumPy array).
However, it is, of course, more common to obtain data by importing it from available sources. Now, this most commonly done by reading data from a CSV file or Excel files. For instance, to import data from a .csv file we can use Pandas read_csv method. Here’s a quick example of how to but make sure to check the blog post about the topic for more information.
import pandas as pd

df = pd.read_csv('CSVFILE.csv')Code language: Python (python)
Now, the above method is only useful when we already have data in a comfortable format such as csv or JSON (see the post about how to parse JSON files with Python and Pandas).
Most of us use Wikipedia to learn information about subjects that interest us. Additionally, these Wikipedia articles often contain HTML tables.
To get these tables in Python using pandas we could cut and paste it into a spreadsheet and then read them into Python using read_excel, for instance. Now, this task can, of course, be done with one less step: it can be automized using web scraping. Make sure to check out what web scarping is.
Prerequisites
Now, of course, this Pandas read HTML tutorial will require that we have Pandas and its dependencies installed. We can, for instance, use pip to install Python packages, such as Pandas, or we install a Python distribution (e.g., Anaconda, ActivePython). Here’s how to install Pandas with pip: pip install pandas. If needed, pip can be used to install a specific version of a package.
Note, if there’s a message that there’s a newer version of pip available check the post about how to upgrade pip. Note, we also need lxml or BeautifulSoup4 installed and these packages can, of course, also be installed using pip:pip install lxml. Now that we have all the Python packages we need, we can go on and read HTML tables with Pandas.
Pandas read_html Syntax
Here’s the simplest syntax of how to use Pandas read_html to scrape data from HTML tables:
pd.read_html('URL_ADDRESS_or_HTML_FILE')Code language: Python (python)
Now that we know the simple syntax of reading an HTML table with Pandas, we can go through the read_html examples.
Pandas read_html Example 1:
In the first example of how to use Pandas read_html method, we are going to read an HTML table from a string.
import pandas as pd

html = '''<table>
  <tr>
    <th>a</th>
    <th>b</th>
    <th>c</th>
    <th>d</th>
  </tr>
  <tr>
    <td>1</td>
    <td>2</td>
    <td>3</td>
    <td>4</td>
  </tr>
  <tr>
    <td>5</td>
    <td>6</td>
    <td>7</td>
    <td>8</td>
  </tr>
</table>'''

df = pd.read_html(html)Code language: Python (python)
Now, the result is not a Pandas DataFrame but a Python list. That is, if we use the type() function we can see that:
type(df)Code language: Python (python)
If we want to get the table, we can use the first index of the list (0):
Pandas read_html Example 2:
In the second, Pandas read_html example, we will scrape data from Wikipedia. In fact, we are going to get the HTML table of Pythonidae snakes (also known as Python snakes).
import pandas as pd

dfs = pd.read_html('https://en.wikipedia.org/wiki/Pythonidae')Code language: Python (python)
Now, we get a list of 7 tables (len(df)). If we go to the Wikipedia page, we can see that the first table is the one to the right. In this example, however, we may be more interested in the second table.
dfs[1]Code language: Python (python)
Pandas read_html Example 3:
In the third example, we are going to read the HTML table from the covid-19 cases in Sweden. Here we’ll use some additional parameters o the read_html method. Specifically, we will use the match parameter. After this, we will also need to clean up the data and, finally, we will do some simple data visualizations.
Scraping Data with Pandas read_html and the match Parameter:
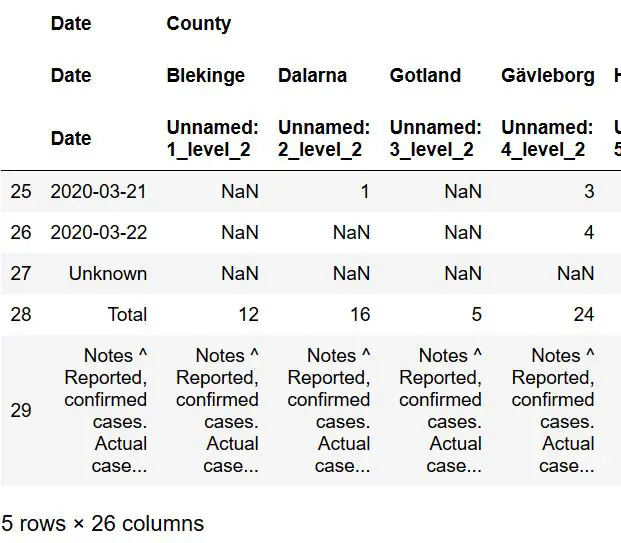
As can be seen, in the image above, the table has this heading: “New COVID-19 cases in Sweden by county”. Now, we can use the match parameter and use this as a string input:
dfs = pd.read_html('https://en.wikipedia.org/wiki/2020_coronavirus_pandemic_in_Sweden',
                  match='New COVID-19 cases in Sweden by county')
dfs[0].tail()Code language: Python (python)
This way, we only get this table but still stored it in a list of dataframes. Now, as can be seen in the image above, we have three rows at the bottom that we need to remove. Thus, in the next section, we are going to remove the last three rows.
Removing the Last rows using Pandas iloc
Now, we are going to remove the last 3 rows using Pandas iloc. Note we use -3 as the second parameter (make sure you check the Pandas iloc tutorial, for more information). Finally, we also make a copy of the dataframe.
df = dfs[0].iloc[:-5, :].copy()Code language: Python (python)In the next section, we will learn how to change the MultiIndex column names to a single index.
MultiIndex to Single Index and Removing Unwanted Characters
Now, we are going to get rid of the MultiIndex columns. That is, we are going to make the 2 column index (the names) to the only column names. Here, we are going to use DataFrame.columns and DataFrame.columns,get_level_values():
df.columns = df.columns.get_level_values(1)Code language: Python (python)
Finally, as seen in the “date” column, we have some notes from the WikiPedia table we have scraped using Pandas read_html. Next, we will remove them using the str.replace method together with a regular expression:
df['Date'] = df['Date'].str.replace(r"\[.*?\]","")<Code language: Python (python)Now that we have cleaned the data with Python, we can make a column index in the Pandas dataframe.
Changing the Index using Pandas set_index
Now, we continue by using Pandas set_index to make the date column the indexes. This is so that we can easily create a time series plot later.
df['Date'] = pd.to_datetime(df['Date'])
df.set_index('Date', inplace=True)Code language: Python (python)
Now, to plot this we need to fill the missing values with zeros and change the data types of these columns to numeric. Here we use the apply method, as well. Finally, we use the cumsum() method to get the added values for each new value in the columns:
df.fillna(0, inplace=True)
df = df.iloc[:,0:21].apply(pd.to_numeric)

df = df.cumsum()Code language: Python (python)
Time Series Plot from HTML Table
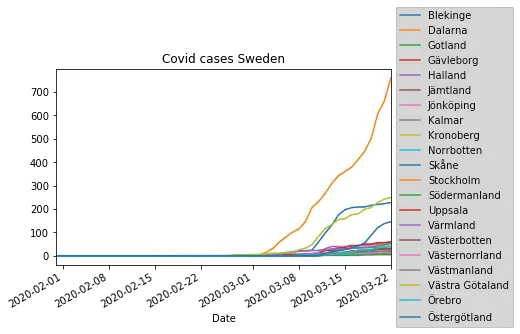
In the final example, we take the data we scraped using Pandas read_html and create a time series plot. Now, we also import matplotlib so that we can change the location of the legend of the Pandas plot:
%matplotlib inline
import matplotlib.pyplot as plt
f = plt.figure()

plt.title('Covid cases Sweden', color='black')
df.iloc[:,0:21].plot(ax=f.gca())

plt.legend(loc='center left', bbox_to_anchor=(1.0, 0.5))Code language: Python (python)
Conclusion: How to Read HTML to a Pandas DataFrame
In this Pandas tutorial, we learned how to scrape data from HTML using Pandas read_html method. Furthermore, we used data from a Wikipedia article to create a time series plot. Finally, it would have been possible to use Pandas read_html with the parameters index_col to set the ‘Date’ column as index column.

Great article
it has to be modified – replace -3 with -5 in following line:
df = dfs[0].iloc[:-3, :].copy()
and one more thing – in last snippet there is one bracket too much – instead of:
plt.legend(loc=’center left’, bbox_to_anchor=(1.0, 0.5)))
use this:
plt.legend(loc=’center left’, bbox_to_anchor=(1.0, 0.5))
Thanks for your feedback, Jan. I am glad you liked the article and appreciate that you found my typos/errors.
thanks for sharing,
as a constructive feedback, you have parenthesis imbalance in
plt.legend(loc=’center left’, bbox_to_anchor=(1.0, 0.5)))
it should be
plt.legend(loc=’center left’, bbox_to_anchor=(1.0, 0.5))
and in order to visualize the plot, a call to plt.show() is needed.
Thanks, Orlando. I have now fixed this.