Are you struggling with standardizing your data or detecting outliers in R? If so, z-scores might be just what you need! In this blog post, we will learn how to calculate z-score in R using different data structures, such as vectors, matrices, and data frames. We will also have a quick look at the z-score formula, its uses, and some examples of how to use z-scores to standardize data and detect outliers. Whether working with hearing science data or any other field, understanding z-scores can help you make sense of your data and make more informed decisions. By the end of this post, you will have a solid understanding of z-scores and how to apply them in R.
Table of Contents
- How to Calculate Z-Score
- Uses of Z-score
- How to Find Z-core in R: Five Examples
- How to Find Z-score in R to Standardize Data
- How to Calculate Z-score in R to Detect Outliers
- Summary: Find Z-score in R
- R Resources
How to Calculate Z-Score
The z-score, also known as the standard score, is a statistical measure that indicates the number of standard deviations a data point is away from the population’s mean. We can use it, e.g., to standardize data and outlier detection.
To calculate the z-score for a data point, you subtract the population’s mean from the data point and then divide that difference by the population’s standard deviation.
Z-Score Formula
The formula for the z-score is:
z = (x – μ) / σ
where:
- x is the data point
- μ is the mean of the population
- σ is the standard deviation of the population
The resulting z-score can be positive or negative, depending on whether the data point is above or below the mean. A z-score of 0 indicates that the data point equals the mean. A positive z-score means the data point is above the mean, and a negative z-score means the data point is below the mean.
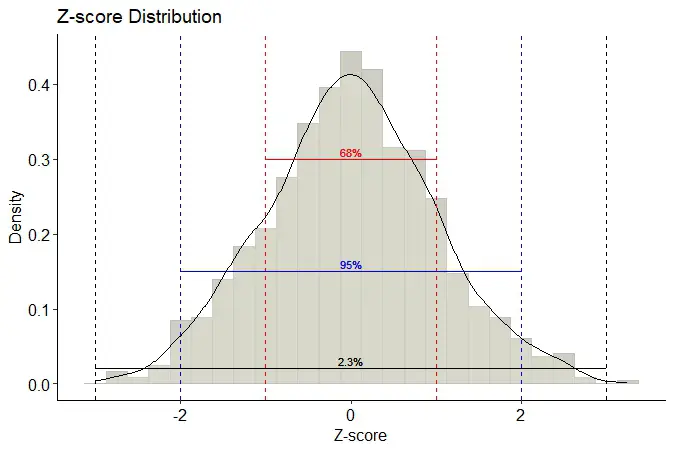
The z-score helps compare data from different datasets because it is standardized, and we can interpret it according to the normal distribution. In a normal distribution, about 68% of the data falls within one standard deviation of the mean, about 95% within two standard deviations, and about 99.7% within three standard deviations. Using the z-score, we can determine the percentage of data within a specific range of standard deviations from the mean.
Z-scores are often used in psychology and hearing science for standardization of data, outlier detection, and comparing scores from different samples or populations. In standardization, z-scores transform data into a standard normal distribution with a mean of 0 and a standard deviation of 1. This transformation allows researchers to compare scores across different measures or scales. In outlier detection, z-scores identify data points far from the mean and may indicate errors or unusual observations. Always check your model assumptions by e,g., making a residual plot in R with ggplot2.
Uses of Z-score
Example 1: Using Z-scores to Standardize Data
In hearing science, z-scores can standardize data from different questionnaires that measure hearing-related outcomes. For example, we may use the Speech, Spatial, and Quality of Hearing Questionnaire (SSQ; Gatehouse & Noble 2004) and the Hearing Handicap Inventory (HHIE; Weinstein & Ventry, 1982) to assess hearing function in individuals with hearing loss. However, these questionnaires use different scoring systems, making comparing scores difficult.
To standardize the scores on each questionnaire, we can calculate the z-scores for each participant’s score on each questionnaire. This transformation will allow us to compare scores across different measures or scales.
For the SSQ, which is measured on a scale of 1-10 (“Not at all” to “Perfectly”), we can calculate the z-score for each participant’s score using the following formula:
- z = (x – μ) / σ
where z is the z-score, x is the participant’s score, μ is the mean for the SSQ scale, and σ is the standard deviation for the SSQ scale.
For example, suppose we have data from 50 participants who completed the SSQ, and the mean SSQ score is 7 with a standard deviation of 1.5. For participant 1, who scored eight on the SSQ, the z-score is:
- z_SSQ = (8 – 7) / 1.5 = 0.67
This indicates that participant 1 scored 0.67 standard deviations above the mean on the SSQ.
Concerning the HHIE, measured on a scale of 1-3 (“Yes”, “Sometimes”, “No”), we can calculate the z-score for each participant’s score using the same formula as for the SSQ.
For example, suppose we have data from 50 participants who completed the HHIE; the mean HHIE score is 2 with a standard deviation of 0.5. For participant 1, who scored 2.5 on the HHIE, the z-score is:
z_HHIE = (2.5 – 2) / 0.5 = 1
This indicates that participant 1 scored one standard deviation above the mean on the HHIE. By standardizing the scores on each questionnaire (i.e., SSQ and HHIE) using z-scores, we can compare the scores across the two questionnaires on a common scale. We can also compare scores between different groups or samples, which can help us to identify differences in hearing-related outcomes.
Example 2: Outlier Detection
Another example of using z-scores in hearing science is using the transformed scores to identify individuals with extreme scores on the SSQ questionnaire.
To detect outliers using z-scores, we will again calculate the z-score for each participant’s SSQ score using the formula:
z = (x – μ) / σ
Once we have calculated the z-scores for each participant’s SSQ score, we can use a threshold value to identify outliers. For example, we might choose a threshold of z = ±2, corresponding to approximately 5% of the data falling outside this range if the data are normally distributed.
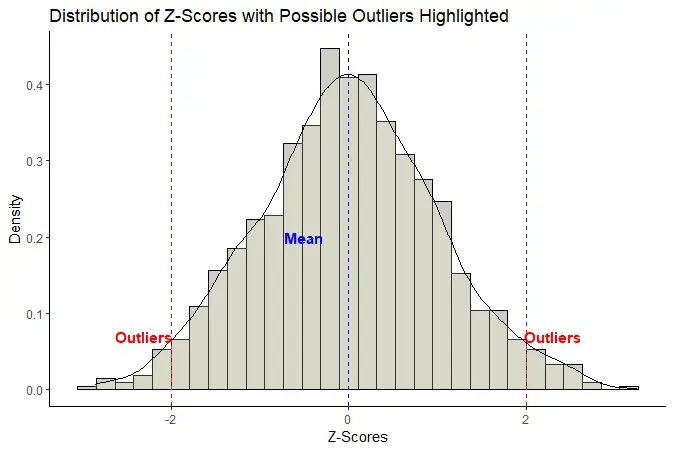
In this case, we will consider participants with z-scores above or below the threshold value as outliers. We may carry out further investigation. These outliers could be due to measurement error, extreme scores on the questionnaire, or other factors.
For example, we have collected data from 50 participants who completed the SSQ questionnaire, and we want to use z-scores to detect outliers. The mean SSQ score is 7.4, with a standard deviation of 0.497.
For participant 1, who scored 7.2 on the SSQ, the z-score is:
z_SSQ = (7.2 – 7.4) / 0.49 = -0.4
We have another participant, participant 2, who scored ten on the SSQ questionnaire. To calculate the z-score for participant 2, we use the formula:
z_SSQ = (8.8 – 7.4) / 0.49= 2.87
Since the z-score for participant 2 is larger than two standard deviations (SD z-score = 1) from the mean z-score of the group of participants, we would consider this participant an outlier based on the z-score criterion.
Again, it is important to remember that the z-score method assumes the data are normally distributed. If the data are not normally distributed, the z-score method may not be appropriate for identifying outliers. Additionally, it is essential to examine the reasons for outliers before removing them from the dataset, as they may be due to genuine variability in the data or other factors that need to be considered in the analysis.
How to Find Z-core in R: Five Examples
In this section, you will find five examples of how to find z-score in R.
Example 1: Calculate Z-score for a Vector
Here is how to find the z-score in R’s vector:
# Generate a vector of hearing thresholds
hearing_thresholds <- c(20, 25, 30, 35, 40)
# Calculate the mean and standard deviation
mean_ht <- mean(hearing_thresholds)
sd_ht <- sd(hearing_thresholds)
# Calculate the z-score for each hearing threshold
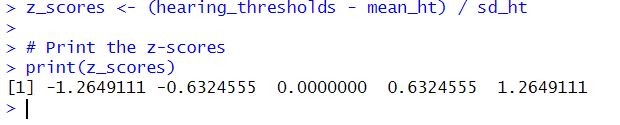
z_scores <- (hearing_thresholds - mean_ht) / sd_ht
# Print the z-scores
print(z_scores)Code language: R (r)In the code chunk above, we first generate a vector of hearing thresholds. Then, we calculate the mean and standard deviation of the hearing thresholds using the mean() and sd() functions, respectively. We then calculate the z-score for each hearing threshold by subtracting the mean from each threshold and dividing it by the standard deviation. Here is the result:
Example 2: Find Z-Score for a Matrix
Here is how to calculate z-score in R for a matrix:
# Generate a matrix of pure-tone audiometry data
pta <- matrix(c(20, 30, 40, 25, 35, 45), nrow = 2)

# Calculate the mean and standard deviation for each column
mean_pta <- apply(pta, 2, mean)
sd_pta <- apply(pta, 2, sd)

# Calculate the z-score for each value in the matrix
z_scores <- sweep(pta, 2, mean_pta, FUN = "-") / sd_pta

# Print the z-scores
print(z_scores)Code language: R (r)
In the code chunk above, we simulate a pure-tone audiometry (PTA) data matrix. Additionally, we calculate each matrix column’s mean and standard deviation using the apply() function. We then calculate the z-score in R for each value in the matrix by subtracting the column mean from each value and dividing by the column standard deviation using the sweep() function.
Example 3: Calculate Z-Score for a DataFrame
Here is to calculate the z-score for columns in R’s dataframe:
# Generate a dataframe of pure-tone audiometry data
df_pta <- data.frame(
  Freq = c(250, 500, 1000, 2000, 4000, 8000),
  Left = c(20, 25, 35, 50, 60, 65),
  Right = c(15, 20, 30, 40, 50, 60)
)

# Calculate the z-score for each value in the left and right columns
df_pta[, 2:3] <- scale(df_pta[, 2:3])
# Print the dataframe with z-score

print(df_pta)Code language: R (r)
In the code chunk above, we first generated a dataframe called df_pta containing pure-tone audiometry data, with frequency values in the Freq column, left ear measurements in the Left column, and right ear measurements in the Right column.
Importantly, we use the scale() function to calculate the z-scores for each value in the Left and Right columns of the df_pta dataframe. The resulting z-scores are then saved back into their respective columns of df_p
Example 4: Find Z-Score for a DataFrame using mutate()
Here is how to calculate z-scores in R using the mutate() function:
# Generate a dataframe with some hearing science data
set.seed(123)
age <- sample(18:70, 10, replace = TRUE)
gender <- sample(c("M", "F"), 10, replace = TRUE)
SSQ <- round(runif(10, min = 10, max = 100) / 10, 1)
PTA <- round(runif(10, min = 35, max = 65), 1)
df <- data.frame(age, gender, SSQ, PTA)
# Find z-scores for the SSQ and PTA columns using mutate()
library(dplyr)
df <- df %>%
mutate(SSQ_z = (SSQ - mean(SSQ)) / sd(SSQ),
PTA_z = (PTA - mean(PTA)) / sd(PTA))
# View the updated dataframe
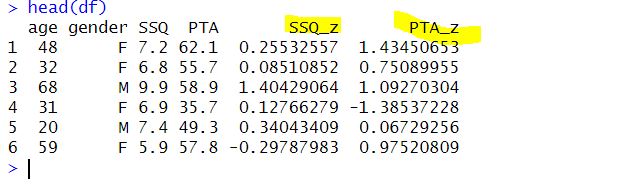
head(df)Code language: PHP (php)In the code chunk above, we first load the dplyr package using the library() function. Then we apply the mutate() function from the dplyr package to the data frame df.
In the mutate() function, we first create two new columns: SSQ_z and PTA_z, which will contain the z-scores. The values in these columns are calculated by subtracting the mean of the respective columns (mean(SSQ) and mean(PTA)) from each value in the columns and then dividing by the standard deviation of the respective columns (sd(SSQ) and sd(PTA)).
The mutate() function returns the modified data frame with the new SSQ_z and PTA_z columns. The df dataframe is then reassigned to this modified data frame using the <- operator. Here is the first six row of the dataframe:
Note that we can use dplyr to rename a column in R, select columns by name or index, and remove duplicates in R’s dataframe, among other things.
Example 5: Calculate z-score for all numeric variables in a dataframe using mutate_if()
Here is to calculate the z-score in R for all numeric variables in a dataframe:
# Generate a dataframe with some hearing science data
set.seed(123)
age <- sample(18:70, 10, replace = TRUE)
gender <- sample(c("M", "F"), 10, replace = TRUE)
SSQ <- round(runif(10, min = 10, max = 100) / 10, 1)
PTA <- round(runif(10, min = 35, max = 65), 1)
df <- data.frame(age, gender, SSQ, PTA)

# Find z-scores for all numeric columns in the dataframe using mutate_if()
library(dplyr)
df <- df %>%
  mutate_if(is.numeric, ~ (.-mean(.)) / sd(.))

# View the updated dataframe
head(df)Code language: PHP (php)
In the code chunk above, we generate a dataframe with hearing science data, including age, gender, SSQ, and PTA. We then use mutate_if() from the dplyr package to find the z-scores for all numeric columns in the dataframe. The mutate_if() function applies a transformation to all columns that meet a specified condition, in this case, all numeric columns using the is.numeric function.
How to Find Z-score in R to Standardize Data
Before we find the z-score in R to standardize data, we will create some fake data.
# Set seed for reproducibility
set.seed(123)
# Generate data for SSQ with mean 7.4 and range 1-10
SSQ <- round(runif(100, min = 1, max = 100) / 10, 1)
SSQ <- round((SSQ - mean(SSQ)) / sd(SSQ) * 1.5 + 7.4, 1)
# Generate data for HHIE
hhie <- sample(1:3, 100, replace = TRUE)
# Combine data into a dataframe
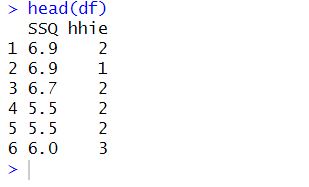
df <- data.frame(SSQ, hhie)
# View the first few rows of the dataframe
head(df)Code language: R (r)In the code chunk above, we first set a random seed to ensure the generated data is reproducible. Then, we use the runif() function to generate 100 uniformly distributed random numbers between 1 and 100. We divide these numbers by 10 to scale them from 1.0 to 10.0 with one decimal point. This gives us the variable SSQ.
However, since we want the mean SSQ to be 7.4, we subtract the mean SSQ from each value in SSQ. We then divide the resulting values by the standard deviation SSQ to get the z-scores. Since we want to shift the mean SSQ to 7.4, we multiply the z-scores by 1.5 (equivalent to adding 1.5 standard deviations to the mean) and then add 7.4 to the result.
Next, we use the sample() function to generate 100 random numbers between 1 and 3 with replacement, giving us the variable hhie. Finally, we combine the SSQ and hhie variables into a data frame named df. The head() function is used to view the first few rows of the resulting data frame.
Find the Z-Score in R
Next, we will calculate the z-score for each column in the dataframe. Here we use the method from the previous examples:
# calculate z-scores for SSQ and HHIE
data$z_ssq <- (data$ssq - mean(data$ssq)) / sd(data$ssq)
data$z_hhie <- (data$hhie - mean(data$hhie)) / sd(data$hhie)Code language: R (r)
Alternatively, we can use mutate() from the dplyr package:
df <- df %>%
  mutate(ssq_zscore = (ssq - mean(ssq)) / sd(ssq),
         hhie_zscore = (hhie - mean(hhie)) / sd(hhie))
Code language: R (r)
In the next section, we will calculate z-scores in R to use for outlier detection.
How to Calculate Z-score in R to Detect Outliers
This section will look at how to standardize data in R using Z-score. First, we generate some data:
# set seed for reproducibility
set.seed(123)

# generate data for SSQ scale
ssq <- round(rnorm(100, mean = 8, sd = 1.5), 1)
# adjust scores above 10 to 10
ssq[ssq > 10] <- 10

# generate data for HHIE scale
hhie <- round(rnorm(100, mean = 2, sd = 0.5), 0)
# adjust scores above 3 to 3
hhie[hhie > 3] <- 3

# create data frame
data <- data.frame(
  ssq = ssq,
  hhie = hhie,
  age = round(rnorm(100, mean = 50, sd = 10)),
  gender = sample(c("male", "female"), 100, replace = TRUE),
  education = round(rnorm(100, mean = 12, sd = 2)),
  pta = round(rnorm(100, mean = 50, sd = 10))
)Code language: R (r)
In the code chunk above, we generate random data for age, gender, education, pure tone average, SSQ scores, and HHIE scores for 100 participants. For the SSQ scores, we use a uniform distribution between 1 and 10 (with decimal values allowed), while for the HHIE scores, we randomly choose integers between 1 and 3.
1. Find Z-Score for Your Variables
To standardize the SSQ and HHIE scores using z-scores, we can use the following formulas:
# calculate z-scores for SSQ and HHIE
data$z_ssq <- (data$ssq - mean(data$ssq)) / sd(data$ssq)
data$z_hhie <- (data$hhie - mean(data$hhie)) / sd(data$hhie)Code language: R (r)
In the code chunk above, we calculate z-score in R for two variables, SSQ and HHIE, in the data frame. We used the mean and sd functions to calculate each variable’s mean and standard deviation.
The z_ssq column is created by subtracting the mean of ssq from each ssq value and dividing by the standard deviation of ssq. Similarly, the z_hhie column is created by subtracting the mean of hhie from each hhie value and dividing by the standard deviation of hhie. The resulting data frame has two new columns, z_ssq and z_hhie, that contain the z-scores for each corresponding variable. Here is another method using mutate() and scale() functions:
library(dplyr)

data <- data %>%
  mutate(z_ssq = scale(ssq),
         z_hhie = scale(hhie))Code language: HTML, XML (xml)
In any way, when we have calculated our z-scores in R, we are ready to use them to identify possible outliers. More about adding columns in R:
- How to Add a Column to a Dataframe in R with tibble & dplyr
- R: Add a Column to Dataframe Based on Other Columns with dplyr
2. Use Z-scores to Detect Possible Outliers
To identify any outliers in the z-score data, we can use the following code:
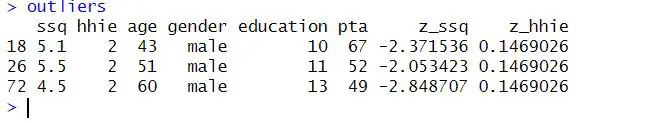
# identify outliers with z-score > 2
outliers <- data[abs(data$z_ssq) > 2 | abs(data$z_hhie) > 2, Code language: R (r)
In the code chunk above, we first calculate the z-scores for the SSQ and HHIE scores using the formula we discussed earlier: z = (x – mean) / sd. We add the z-scores as new columns to the data dataframe.
Finally, we identify outliers by selecting rows where the absolute value of the z-score for SSQ or HHIE is greater than 2 (i.e., more than two standard deviations from the mean). Note that we used “|”, the or operator in R. We store the outliers in a new data frame called outliers. Here is the result:
Other Methods to Detect Outliers
Although z-scores help to identify outliers, they are not always enough. Sometimes, other techniques can help identify the outliers, such as box plots, scatter plots, Cook’s distance, and leverage points. Additionally, when analyzing data, it is always important to remember the context of the data and the research question, as some outliers may be valid observations and not necessarily errors in the data. Combining multiple methods can improve our ability to detect outliers and make more informed decisions about their treatment in our analyses.
- Boxplots: Boxplots use quartiles to identify potential outliers as data points that fall outside the interquartile range (IQR).
- Tukey’s Method: Tukey’s Method uses the IQR to identify potential outliers as data points more than 1.5 times the IQR away from the first or third quartile.
- Modified Z-score: The modified z-score is a variation of the z-score method that is robust to outliers. It calculates the standardized score using the median and median absolute deviation (MAD).
- Mahalanobis Distance: Mahalanobis distance measures the distance between a data point and the center of a dataset, considering the covariance between variables. Outliers are identified as points with a high Mahalanobis distance.
- Cook’s Distance: Cook’s distance measures the influence of a single observation on the regression coefficients. Points with a high Cook’s distance are considered potential outliers.
If you need to check your data, you can learn how to make a scatter plot in R with Ggplot2, for example.
Now that you have standardized and found your outliers, you may want to, e.g., calculate descriptive statistics, sum across multiple columns, or rename variables in your dataframe.
Summary: Find Z-score in R
In this blog post, I’ve shown you how to calculate the z-score in R. You have learned what the z-score is, how it is calculated, and why it’s useful in statistical analysis. Moreover, you have seen five examples of calculating z-score in R, including using a vector, matrix, and dataframe. Finally, you have also learned to find z-score in R to standardize data and detect outliers.
Using z-scores to standardize data helps you compare data on different scales. We can use z-scores to detect outliers, which can affect the results of statistical analyses. By standardizing data using a z-score, you can detect outliers, which can affect the results of statistical analyses.
By using R, you can easily calculate z-score for your data, and I hope these examples have given you a good understanding of how to do so. If you encounter any errors or have questions about your learning, don’t hesitate to comment on the blog post.
If you found this blog post helpful, please share it on your social media channels. Sharing is caring, and it might help someone else too! Here is a Markdown file with all the code examples: https://github.com/marsja/RPostsCode/blob/main/z_score_in_R.md
References
Gatehouse, S., & Noble, I. (2004). The Speech, Spatial and Qualities of Hearing Scale (SSQ). International Journal of Audiology, 43(2), 85–99. https://doi.org/10.1080/14992020400050014
Weinstein, B. E., & Ventry, I. M. (1983). Audiometric correlates of the hearing handicap inventory for the elderly. Journal of Speech and Hearing Disorders, 48(4), 379-384.
R Resources
Here are some awesome resources that you may find handy:
- How to Create a Word Cloud in R
- Master or in R: A Comprehensive Guide to the Operator
- Mastering SST & SSE in R: A Complete Guide for Analysts
- Sum Across Columns in R – dplyr & base
- Countif function in R with Base and dplyr
- Coefficient of Variation in R
- Correlation in R: Coefficients, Visualizations, & Matrix Analysis