In this Python tutorial, you will learn how to 1) perform Bartlett’s Test, and 2) Levene’s Test. Both are tests that are testing the assumption of equal variances. Equality of variances (also known as homogeneity of variance, and homoscedasticity) in population samples is assumed in commonly used comparison of means tests, such as Student’s t-test and analysis of variance (ANOVA). Therefore, we can employ tests such as Levene’s or Bartlett’s that can be conducted to examine the assumption of equal variances across group samples.
Table of Contents
- Outline
- Hypotheses
- Prerequisites
- Example Data
- How to Do Bartlett’s Test of Homogeneity of Variances in Python
- How to Carry out Levene’s Test of Equality of Variances in Python
- Conclusion
- Resources
Outline
A brief outline of the post is as follows. First, you will get a couple of questions answered. Second, you will briefly learn about the hypothesis of both Bartlett’s and Levene’s tests of homogeneity of variances. After this, we continue by having a look at the required Python packages to follow this post. In the next section, you will read data from a CSV file so that we can continue learning how to carry out both tests of equality of variances in Python. That is, the last two sections, before the conclusion, will show you how to carry out Bartlett’s and Levene’s tests.
Bartlett’s test of homogeneity of variances, much like Levene’s test, measures whether the variances are equal for all samples. If your data is normally distributed you can use Bartlett’s test instead of Levene’s.
Levene’s test can be carried out to check that variances are equal for all samples. The test can check the assumption of equal variances before running a parametric test like One-Way ANOVA in Python. If your data is not following a normal distribution Levene’s test is preferred before Barlett’s.
Simple described, equal variances, also known as homoscedasticity, is when the variances are approximately the same across the samples (i.e., groups). If our samples have unequal variances (heteroscedasticity), on the other hand, it can affect the Type I error rate and lead to false positives. This is what equality of variances means.
Hypotheses
Whether conducting Levene’s Test or Bartlett’s Test of homogeneity of variance, we are dealing with two hypotheses. These two are put:
- Null Hypothesis: the variances are equal across all samples/groups
- Alternative Hypothesis: the variances are not equal across all samples/groups
This means, for example, that if we get a p-value larger than 0.05 we can assume that our data is heteroscedastic and we can continue carrying out a parametric test such as the two-sample t-test in Python. If we, on the other hand, get a statistically significant result, we may want to carry out the Mann-Whitney U test in Python.
Prerequisites
In this post, we will use the following Python packages:
- Pandas will be used to import the example data
- SciPy and Pingouin will be used to carry out Levene’s and Bartlett’s tests in Python
Of course, if you have your data in any other format (e.g., NumPy arrays) you can skip using Pandas and work with e.g. SciPy anyway. However, to follow this post it is required that you have the Python packages installed. In Python, you can install packages using Pip or Conda, for example. Here’s how to install all the needed packages:
pip install scipy pandas pingouinCode language: Bash (bash)Note, to use pip to install a specific version of a package you can do type:
pip install scipy==1.5.2 pandas==1.1.1 pingouin==0.3.7Code language: Bash (bash)Make sure to check out how to upgrade pip if you have an old version installed on your computer. That said, let’s move on to the next section in which we start by importing example data using Pandas.
Example Data
To illustrate the performance of the two tests of equality of variance in Python we will need a dataset with at least two columns: one with numerical data, the other with categorical data. In this example, we are going to use the PlantGrowth.csv data which contains exactly two columns. Here’s how to read a CSV with Pandas:
import pandas as pd


# Read data from CSV
df = pd.read_csv('PlantGrowth.csv',
                index_col=0)

df.shapeCode language: PHP (php)
If we use the shape method we can see that we have 30 rows and 2 columns in the dataframe. Now, we can also print the column names of the Pandas dataframe like this. This will give us information about the names of the variables. Finally, we may also want to see which data types we have in the data. This can, among other things, be obtained using the info()method:
df.info()Code language: CSS (css)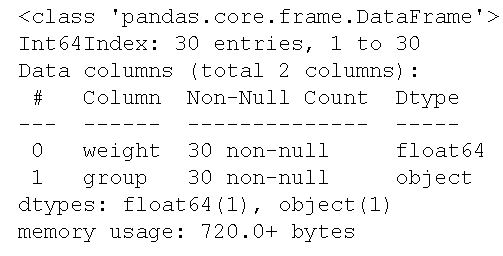
As we can see, in the image above, the two columns are of the data types float and object. More specifically, the column weight is of float data type and the column called group is an object. This means that we have a dataset with categorical variables. Exactly what we need to practice carrying out the two tests of homogeneity of variances.
In the next section, we are going to learn how to carry out Bartlett’s test in Python with first SciPy and, then, Pingouin. Note, when we are using Pingouin we are actually using SciPy but we get a nice table with the results and can, using the same Python method, carry out Levene’s test. That said, let’s get started with testing the assumption of homogeneity of variances!
How to Do Bartlett’s Test of Homogeneity of Variances in Python
In this section, you will learn two methods (i.e., using two different Python packages) for carrying out Bartlett’s test in Python. First, we will use SciPy:
1 Bartlett’s Test with SciPy
Here’s how to do Bartlett’s test using SciPy:
from scipy.stats import bartlett
# subsetting the data:
ctrl = df.query('group == "ctrl"')['weight']
trt1 = df.query('group == "trt1"')['weight']
trt2 = df.query('group == "trt2"')['weight']
# Bartlett's test in Python with SciPy:
stat, p = bartlett(ctrl, trt1, trt2)
# Get the results:
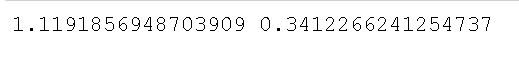
print(stat, p)Code language: Python (python)As you can see, in the code chunk above, we started by importing the bartlett method from the stats class. Now, bartlett() takes the different sample data as arguments. This means that we need to subset the Pandas dataframe we previously created. Here we used Pandas query() method to subset the data for each group. In the final line, we used the bartlett() method to carry out the test. Here are the results:

Remember the null and alternative hypothesis of the two tests we are learning in this blog post? Good, because judging from the output above, we cannot reject the null hypothesis and can, therefore, assume that the groups have equal variances.
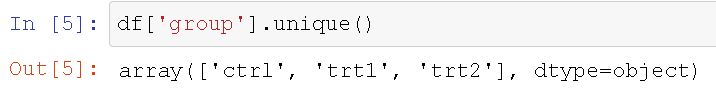
Note, you can get each group by using the unique() method. For example, to get the three groups we can type df[‘group’].unique() and we will get this output.
2 Using Pingouin’s homoscedasticity method
Here’s another method to carry out Bartlett’s test of equality of variances in Python:
import pingouin as pg

# Bartlett's test in Python with pingouin:
pg.homoscedasticity(df, dv='weight',
                    group='group',
                   method='bartlett')Code language: Python (python)
In the code chunk above, we used the homoscedasticity method and used the Pandas dataframe as the first argument. As you can see, using this method to carry out Bartlett’s test is a bit easier. That is, using the next two parameters we specify the dependent variable and the grouping variable. This means that we don’t have to subset the data as when using SciPy directly. Finally, we used the method parameter to carry out Bartlett’s test. As you will see, in the next section, if we don’t do this we will carry out Levene’s test.
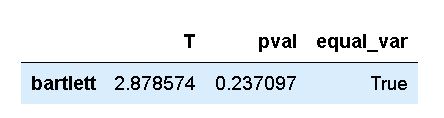
As you may already know, and as stated earlier in the post, Bartlett’s test should only be used if data is normally distributed. In the next section, we will learn how to carry out an alternative test that can be used for non-normal data.
How to Carry out Levene’s Test of Equality of Variances in Python
In this section, you will earn two methods to carry out Levene’s test of homogeneity of variances in Python. As in the previous section, we will start by using SciPy and continue using Pingouin.
1 Levene’s Test with SciPy
To carry out Levene’s test with SciPy we can do as follows:
from scipy.stats import levene

# Create three arrays for each sample:
ctrl = df.query('group == "ctrl"')['weight']
trt1 = df.query('group == "trt1"')['weight']
trt2 = df.query('group == "trt2"')['weight']

# Levene's Test in Python with Scipy:
stat, p = levene(ctrl, trt1, trt2)

print(stat, p)Code language: PHP (php)
In the code chunk above, we started by importing the levene method from the stats class. Much like when using the bartlett method, levene takes the group’s data as arguments (i.e., one array for each group). Again, we will have to subset the Pandas dataframe containing our data. Subsetting the data is, again, done using Pandas query() method. In the final line, we used the levene() method to carry out the test.
2 Using Pingouin’s homoscedasticity method
Here’s the second method to perform out Levene’s test of homoscedasticity in Python:
import pingouin as pg

# Levene's Test in Python using Pingouin
pg.homoscedasticity(df, dv='weight',
                    group='group')Code language: Python (python)
In the code chunk above, we used the homoscedasticity method. This method takes the data, in this case, our dataframe, as the first parameter. As you when carrying out Bartlett’s test with this package, it is easier to use when performing Levene’s test as well. The next two parameters to the method is where we specify the dependent variable and the grouping variable. This is quite awesome as we don’t have to subset the dataset ourselves. Note, that we don’t have to use the method parameter (as when performing Bartlett’s test) because the homoscedasticity method will, by default, do Levene’s test.
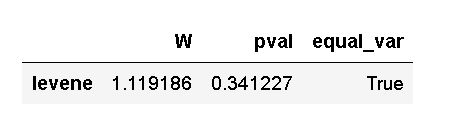
Now, as testing the assumption of equality of variances using Pingouin is, in fact, using SciPy the results are, of course, the same regardless of Python method used. In this case, the samples have roughly equal variances with the example data we used. Good news, if we want to compare the groups on their mean values!
Conclusion
In this Python tutorial, you have learned to carry out two tests of equality of variances. First, we used Bartlett’s test of homogeneity of variance using SciPy and Pingouin. This test, however, should only be used on normally distributed data. Therefore, we also learned how to carry out Levene’s test using the same two Python packages! Finally, we also learned that Pingouin uses SciPy to carry out both tests but works as a simple wrapper for the two SciPy methods and is very easy to use. Especially if our data is stored in a Pandas dataframe.
Resources
Here are plenty more tutorials you will find helpful:
- Coefficient of Variation in Python with Pandas & NumPy
- Python Check if File is Empty: Data Integrity with OS Module
- Find the Highest Value in Dictionary in Python
- Python Scientific Notation & How to Suppress it in Pandas & NumPy