In this data analysis tutorial, you will learn how to carry out a Mann-Whitney U test in Python with the packages SciPy and Pingouin. This test is also known as Mann–Whitney–Wilcoxon (MWW), Wilcoxon rank-sum test, or Wilcoxon–Mann–Whitney test and is a non-parametric hypothesis test.
Table of Contents
- Outline of the Post
- When to use the Mann-Whitney U test
- Example
- Prerequisites
- 2 Steps to Perform the Mann-Whitney U test in Python
- Mann-Whitney U Test with the Python Package Pingouin
- Interpreting the Results of the Mann-Whitney U test
- Conclusion
- References
- Resources
Outline of the Post
This tutorial will teach you when and how to use this non-parametric test. After that, we will see an example of a situation when the Mann-Whitney U test can be used. The example is followed by how to install the needed package (i.e., SciPy) as well as a package that makes importing data easy and that we can quickly visualize the data to support the interpretation of the results. In the following section, you will learn the two steps to carry out the Mann-Whitney-Wilcoxon test in Python. Note we will also look at another package, Pingouin, that enables us to carry out statistical tests with Python. Finally, we will learn how to interpret the results and visualize data to support our interpretation.
When to use the Mann-Whitney U test
This test is a rank-based test that can be used to compare values for two groups. If we get a significant result it suggests that the values for the two groups are different. As previously mentioned, the Mann-Whitney U test is equivalent to a two-sample Wilcoxon rank-sum test.
Furthermore, we don’t have to assume that our data follows the normal distribution and can decide whether the population distributions are identical. Now, the Mann–Whitney test does not address hypotheses about the medians of the groups. Rather, the test addresses whether an observation in one group is likely greater than an observation in the other group. In other words, it concerns whether one sample has stochastic dominance compared with the other.
The test assumes that the observations are independent. That is, it is not appropriate for paired observations or repeated measures data.
Appropriate data
- One-way data with two groups: two-sample data, that is,
- Your dependent variable is of one of the three following: 1) ordinal, 2) interval, or 3) ratio,
- The independent variable is a factor with two levels (again, only two groups, see the first point),
- Observations between groups are independent. That is, not paired or repeated measures data
- To be a test of medians, the distributions of values for both the groups have to be of similar shape and spread. Under other conditions, the Mann-Whitney U test is by and large a test of stochastic equality.
Hypotheses
As with the two samples t-test there are normally two hypothesis:
- Null hypothesis (H0): The two groups are sampled from populations with identical distributions. Typically, the sampled populations exhibit stochastic equality.
- Alternative hypothesis (Ha: The two groups are sampled from populations with different distributions (see the previous section). This usually means that one sampled population (group) displays stochastic dominance.
Interpretation
If the results are significant, they can be reported as “The values for men were significantly different from those for women.”, if you are examining differences in values between men and women.
You can use the Mann-Whitney U test when your outcome/dependent variable is ordinal or continuous but not normally distributed. Furthermore, this non-parametric test is used when you want to compare differences between two independent groups (e.g., as an alternative to the two-sample t-test).
To conclude, you should use this test instead of e.g., two-sample t-test using Python if the above information is true for your data.
Example
In this section, before moving on to how to carry out the test, we will have a quick look at an example of when you should use the Mann-Whitney U test.
If you, for example, run an intervention study designed to examine the effectiveness of a new psychological treatment to reduce symptoms of depression in adults. Let’s say that you have a total of n=14 participants. Furthermore, these participants are randomized to receive either the treatment or no treatment. In your study, the participants are asked to record the number of depressive episodes over one week following receipt of the assigned treatment. Here are some example data:
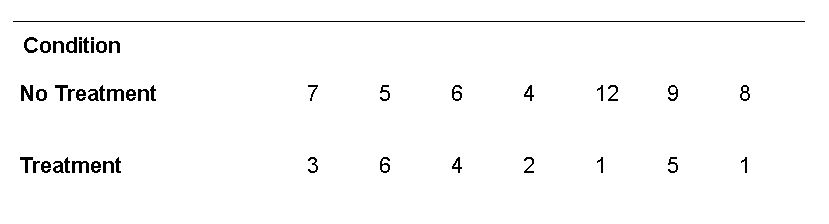
In this example, the question you might want to answer is: is there a difference in the number of depressive episodes over a 1 week period in participants receiving the new treatment as in comparison to those receiving no treatment? By inspecting your data, it appears that participants receiving no treatment have more depressive episodes. The crucial question is, however, is this statistically significant?
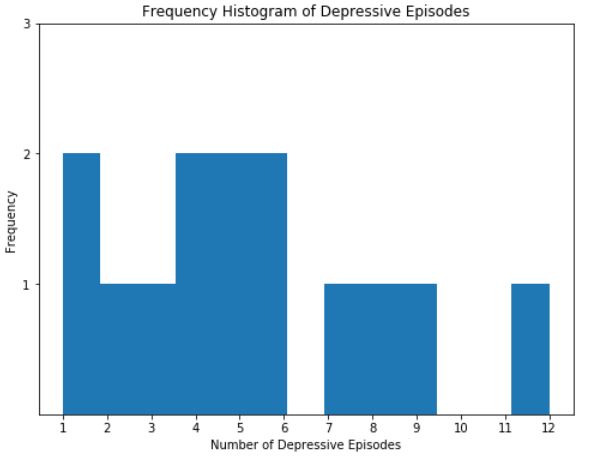
In this example, the outcome variable is the number of episodes (count), and, naturally, in this sample, the data do not follow a normal distribution. Note, Pandas was used to create the above histogram.
Prerequisites
To follow this tutorial, you must have Pandas and SciPy installed. Now, you can get these packages using your favorite Python package manager. For example, installing Python packages with pip can be done as follows:
pip install scipy pandas pingouinCode language: Bash (bash)Note both Pandas and Pingouin are optional. However, using these packages has, as you will see later, their advantages. Hint, Pandas make data importing easy. If you ever need it, you can also use pip to install a specific version of a package.
2 Steps to Perform the Mann-Whitney U test in Python
In this section, we will go through the steps to carry out the Mann-Whitney U test using Pandas and SciPy. In the first step, we will get our data. After storing the data in a dataframe, we will carry out the non-parametric test.
Step1: Get your Data
Here’s one way to import data to Python with Pandas:
import pandas as pd

# Getting our data in to a dictionary
data = {'Notrt':[7, 5, 6, 4, 12, 9, 8],
        'Trt':[3, 6, 4, 2, 1, 5, 1]}

# Dictionary to Dataframe
df = pd.DataFrame(data)Code language: Python (python)
In the code chunk above, we created a Pandas dataframe from a dictionary. Of course, most of the time, we will store our data in formats such as CSV or Excel.
See the following posts about how to import data in Python with Pandas:
- Pandas Read CSV Tutorial: How to Read and Write
- How to Read & Write SPSS Files in Python using Pandas
- Pandas Excel Tutorial: How to Read and Write Excel files
- How to use Pandas read_html to Scrape Data from HTML Tables
Here’s also worth noting that if your data is stored in long format, you will have to subset your data such that you can get the data from each group into two different variables.
Step 2: Use the mannwhitneyu method from SciPy:
Here’s how to perform the Mann-Whitney U test in Python with SciPy:
from scipy.stats import mannwhitneyu

# Carrying out the Wilcoxon–Mann–Whitney test
results = mannwhitneyu(df['Notrt'], df['Trt'])
resultsCode language: Python (python)
Notice that we selected the columns, for each group, as x and y parameters to the mannwhitneyu method. If your data, as previously mentioned, is stored in long format (e.g., see image further down below) you can use Pandas query() method to subset the data.
Here’s how to perform the test using df.query(), if your data is stored in a similar way as in the image above:
import pandas as pd

idrt = [i for i in range(1,8)]
idrt += idrt

data = {'Count':[7, 5, 6, 4, 12, 9, 8,
                3, 6, 4, 2, 1, 5, 1],
       'Condition':['No Treatment']*7 + ['Treatment']*7, 'IDtrt':idrt}

# Dictionary to Dataframe
df = pd.DataFrame(data)


# Subsetting (i.e., creating new variables):
x = df.query('Condition == "No Treatment"')['Count']
y = df.query('Condition == "Treatment"')['Count']

# Mann-Whitney U test:
mannwhitneyu(x, y)Code language: Python (python)
Now, there are some things to be explained here. First, the mannwhitneyu method will by default carry out a one-sided test. On the other hand, if we would use the parameter alternative and set it to “two-sided” we would get different results. Make sure you check out the documentation before using the method. In the next section, we will look at another, previously mentioned, Python package that can also be used to do the Mann-Whitney U test.
Mann-Whitney U Test with the Python Package Pingouin
As previously mentioned, we can also install the Python package Pingouin to carry out the Mann-Whitney U test. Here’s how to perform this test with the mwu() method:
from pingouin import mwu

results2 = mwu(df['Notrt'], df['Trt'],
               tail='one-sided')Code language: Python (python)
Now, the advantage with using the mwu method is that we will get some additional information (e.g., common language effect size; CLES). Here’s the output:
Interpreting the Results of the Mann-Whitney U test
In this section, we will start by interpreting the test results. Now, this is pretty straightforward.
In our example, we can reject H0 because 3 < 7. Furthermore, we have statistically significant evidence at α =0.05 to show that the treatment groups differ in the number of depressive episodes. Naturally, in a real application, we would have set both the H0 and Ha before conducting the hypothesis test, as we did here.
Visualizing the Data with Boxplots
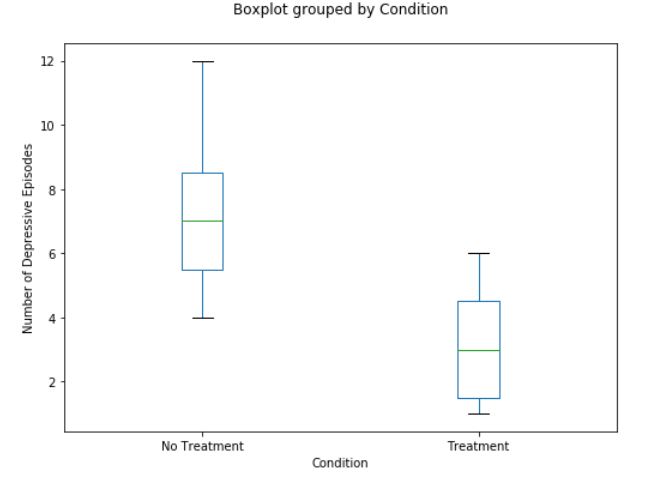
To aid the interpretation of our results, we can create box plots with Pandas:
axarr = df.boxplot(column='Count', by='Condition',
                   figsize=(8, 6), grid=False)
axarr.set_title('')
axarr.set_ylabel('Number of Depressive Episodes')Code language: Python (python)
In the box plot, we can see that the median is greater for the group that did not get any treatment than the group that got treatment. Furthermore, if there were any outliers in our data they would show up as dots in the box plot. If you are interested in more data visualization techniques, look at the post “9 Data Visualization Techniques You Should Learn in Python”.
Conclusion
In this post, you have learned how to perform the Mann-Whitney U test using the Python packages SciPy, Pandas, and Pingouin. Moreover, you have learned when to carry out this non-parametric test by learning about e.g., when it is appropriate and by an example. After this, you learned how to conduct the test using data from the example. Finally, you have learned how to interpret the results and visualize the data. Note that you preferably should have a larger sample size than in the example of the current post. Of course, you should also decide whether to carry out a one-sided or two-sided test based on theory. In the example of this post, we can assume that going without treatment would mean more depressive episodes. However, in other examples, this may not be true.
I hope you have learned something, and if you have a comment, a suggestion, or anything, you can leave a comment below. Finally, I would very much appreciate it if you shared this post across your social media accounts if you found it useful!
References
In this final section, you will find some references and resources that may prove useful. Note, there are both links to blog posts and peer-reviewed articles. Sadly, some of the content here is behind paywalls.
Mann, H. B.; Whitney, D. R. On a Test of Whether one of Two Random Variables is Stochastically Larger than the Other. Ann. Math. Statist. 18 (1947), no. 1, 50–60. doi:10.1214/aoms/1177730491. https://projecteuclid.org/euclid.aoms/1177730491
Vargha, A., & Delaney, H. D. (2000). A Critique and Improvement of the CL Common Language Effect Size Statistics of McGraw and Wong. Journal of Educational and Behavioral Statistics, 25(2), 101–132. https://doi.org/10.3102/10769986025002101
Resources
Here are other Python tutorials that are helpful:
- Coefficient of Variation in Python with Pandas & NumPy
- Python Check if File is Empty: Data Integrity with OS Module
- Pandas Count Occurrences in Column – i.e. Unique Values
- How to Make a Column Index in Pandas Dataframe – with Examples
- Adding New Columns to a Dataframe in Pandas (with Examples)
With respect !!!
Thanks for your comment.