In this post, we will learn how to calculate variance in R. Variance provides insights into the variability within a dataset, making it an important tool in statistical analysis. We will look at two different methods for calculating variance in R, using the robust capabilities of both base R functions such as var() and dplyr’s summarize() and group_by() functions.
Calculating variance is particularly important when examining the spread of data values and understanding the reliability of our measurements. We will learn the steps involved in computing sample variance and showcase how to use the power of R for practical variance analysis.
Table of Contents
- Outline
- Prerequisites
- var() and cov()
- Base R: Calculating Variance for Single and Multiple Columns
- How to Calculate Variance in R with dplyr
- Calculate Variance in R by group with dplyr
- Conclusion
- Resources
Outline
This post is structured as follows. First, we explore the prerequisites, understanding the var() and cov() functions and their parameters, essential for calculating variances and covariances in R. This is followed by looking at base R techniques, demonstrating how to calculate variance for single and multiple columns. Following that, we shift to the dplyr package, a handy tool for data manipulation, and look at three examples of calculating variance. Here, we start with a single column and progress to two columns and all numeric variables. Each example is presented clearly using dplyr’s functions, offering a practical approach to data analysis. Additionally, we cover how to calculate variance by group, utilizing the group_by() function to break down variance calculations within distinct groups.
Prerequisites
Before calculating variance in R, ensure you understand loading data into R, creating, and saving scripts. Familiarity with R’s fundamental concepts, such as data frames and basic statistical functions, is beneficial. This tutorial covers the essentials of variance calculation, making it accessible to users at various skill levels. If you can comfortably navigate R and perform basic data manipulations, you will be able to follow along without any problems.
var() and cov()
We frequently employ the var() or cov()functions with a numeric vector, matrix, or dataframe denoted by the x argument. In most cases, we do not use the y parameter set to NULL by default, as it corresponds to the same data as x, ensuring computational efficiency. We can use the na.rm logical argument when dealing with missing values, allowing us to specify whether or not these values should be removed from the variance calculation.
Additionally, we can use the use argument. This optional character string provides methods for handling missing values, offering flexibility based on specific analytical needs. By using these parameters, we can customize the behavior of the var() function, ensuring seamless variance calculations in diverse scenarios. Note that cov()has an additional parameter to use (method).
Base R: Calculating Variance for Single and Multiple Columns
1. Calculating Variance for a Single Column
Let us examine how to calculate variance for a single numeric column in R. Here is how we select on column in R’s dataframe and calculate variance:
# Calculate variance for a single column
variance_variable1 <- var(data$Var1)
Code language: R (r)
In the code chunk above, we calculate the variance for a single column, Var1, in the specified dataframe data. We used the $ operator to select the column of interest within the dataframe. This example serves as a template for readers to calculate the variance for your dataframe and variable by replacing data with your dataframe name and Var1 with the desired variable name.
2. Calculating Variance for Two Columns
If we want to find the variance for two columns in R’s dataframe we can do like this:
# Calculate variance for a two columns
variance_variable1 <- var(data$Var1)
variance_variable12 <- var(data$Var2)Code language: PHP (php)
In the code chunk above, we calculate the variance for two columns, Var1 and Var2, in the specified dataframe data. We added a line for the second variable, Var2. This approach is similar to the previous example (see the explanation above). Note that Var1 and Var2 should be exchanged for your variable names if you are adapting the code for your specific dataset.
3. Calculating Variance for All Numeric Variables
We can also use the apply() function together with var() to calculate variance for all numeric variables:
# Calculate variance for all numeric variables
all_numeric_variances <- apply(data[,
                                    sapply(data, is.numeric)],
                               2, var)Code language: R (r)
In the code chunk above, we use the apply() function to calculate the variance for all numeric variables in R in the specified dataframe data. We used the inner sapply() function to identify numeric variables, and the resulting logical vector was applied to the dataframe columns. We use 2 in apply() to indicate that the function should be applied to columns. This concise approach efficiently computes variances across all numeric variables, providing a convenient summary. The result, all_numeric_variances, contains the dataset’s variance values for each numeric variable. In the following section, we will use summarize() and var() to find variance in R, Here are some post about converting all (e.g., numeric) variables in R:
- Convert Multiple Columns to Numeric in R with dplyr
- Convert All Character Columns to Factor in R: A Guide
How to Calculate Variance in R with dplyr
In R, the dplyr package offers a handy set of tools for data manipulation. One essential function is summarize(), which enables concise data summarization. Particularly useful for calculating descriptive statistics in R, summarize() simplifies complex operations. In this section, we will look at examples using the summarize() with the variance calculation (var()), showcasing its efficiency and clarity.
Example 1: Calculate Variance in R for a Single Column using dplyr:
To calculate the variance for a single column using dplyr, we use the summarize() function. Here is a code example:
variance_variable1 <- data %>%
  summarize(variance_Var1 = var(Var1))
Code language: HTML, XML (xml)
In the code chunk above, we use the %>% (pipe) operator to pipe the dataframe data into the summarize() function. Within summarize(), we calculate the variance of the variable Var1 using the var() function and assign it to the new variable variance_Var1. As a result, we get a tibble containing only one column with the variance calculated for variable 1. We can use the pull() function if we want to extract the variance as a value:
variance_variable1 <- variance_variable1 %>% pull()Code language: HTML, XML (xml)
In the code chunk above, we utilize the %>% (pipe) operator to extract the calculated variance for a single variable from the dataframe created by the summarize() function. The pull() function is employed to extract the result as a vector. Remember, when adapting this code for your specific case, replace data with your dataframe and Var1 with the variable of interest.
Example 2: Calculate Variance for Two Columns using dplyr
Expanding upon the single-column example, we now demonstrate how to calculate the variance for two columns simultaneously.
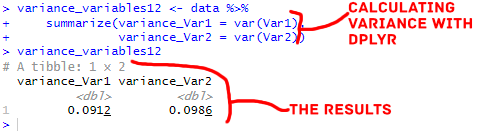
variance_variables12 <- data %>%
  summarize(variance_Var1 = var(Var1),
            variance_Var2 = var(Var2))Code language: R (r)
In the code snippet above, we employ the summarize() function from the dplyr package to calculate the variances for two variables simultaneously, Var1 and Var2. The resulting dataframe, variance_variables12, contains the calculated variances in a tidy format. This example extends the previous single-variable case, showcasing the flexibility of dplyr’s summarize() function. To adapt this code for your specific variables, replace Var1 and Var2 with the names of the variables you wish to analyze.
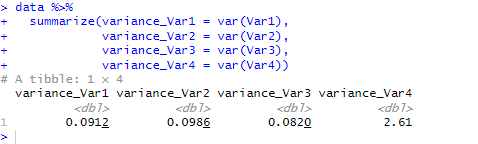
Note that you can extend the process by adding more lines for additional variables (e.g., Var3):
Example 3: Calculate Variance for All Numeric Variables using dplyr:
In this example, we illustrate how dplyr’s summarize() efficiently computes variances for all numeric variables in the dataset.
all_numeric_variances_dplyr <- data %>%
  summarize(across(where(is.numeric), var))
Code language: R (r)
In the code chunk above, we used dplyr’s summarize() function in combination with the across() function to efficiently calculate variances for all numeric variables within the dataset. The across() function enables us to apply the var() function to multiple columns specified by the where(is.numeric) condition, which filters out only the numeric columns. This concise and scalable approach allows straightforward variance calculations across various numeric variables.
Using the dplyr framework, we have achieved a more streamlined and readable code structure than Base R. The resulting dataframe, all_numeric_variances_dplyr, presents the calculated variances in a tidy format. To adapt this code for your dataset, replace data with your dataframe name, and the function will efficiently calculate variances for all numeric variables in your specific dataset.
Calculate Variance in R by group with dplyr
To illustrate how we can calculate variance with grouping in R, let us consider a dataset related to hearing. In this dataset, we have information on individuals grouped by their hearing status (impaired or normal).
First, we will use the dplyr package to create a grouped dataframe based on the hearing status. We use the group_by() function to segment the data into distinct groups. In this case, we will use the Hearing_Status variable to define our two groups: “Impaired” and “Normal”.
grouped_data <- data %>%
  group_by(Hearing_Status)
Code language: R (r)
In the code chunk above, we created the new dataframe (which is grouped) called grouped_data. Now, let us calculate the variance for a specific variable within each group. For example, if we have a variable ‘Age’, we can calculate age variance for impaired and normal hearing groups using the summarize() function.
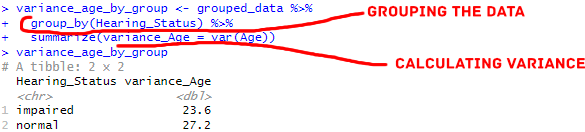
variance_age_by_group <- grouped_data %>%
  summarize(variance_Age = var(Age))
Code language: HTML, XML (xml)
In the code chunk above, we use summarize() on the grouped data (grouped_data). In this case, the summarize() function allows us to compute summary statistics for each group. Here, we are calculating each group’s variance of the ‘Age’ variable. The resulting dataframe variance_age_by_group will have a column named variance_Age representing the variance of ages for each hearing status group.
This method using dplyr’s group_by() and summarize() functions simplifies calculating variances for specific variables within distinct groups. It offers a more concise and readable approach than base R, where extensive code would be required. With dplyr, we can succinctly express complex operations, enhancing the efficiency and interpretability of our code.
Moreover, the examples demonstrated for calculating variance for multiple variables and all numeric variables in the entire dataset can be applied to the grouped dataframe. This flexibility makes the dplyr approach more versatile and user-friendly, allowing us to adapt the same methods for diverse analyses with minimal modifications. Remember to substitute ‘data’ with your actual dataframe name and choose the variable(s) of interest for variance calculation. We can also combine the the code chunks above, using the pipe operator:
# Group by Hearing_Status and calculate variance of Age
variance_age_by_group <- grouped_data %>%
  group_by(Hearing_Status) %>%
  summarize(variance_Age = var(Age))

# Display the result
variance_age_by_group
Code language: PHP (php)
Conclusion
In conclusion, this guide has walked you through calculating variances in R using both base R functions and the dplyr package. Whether you opt for the simplicity of base R or the elegance of dplyr, you now understand how to derive variances for single or multiple columns. dplyr’s concise syntax and versatility offer a streamlined approach, particularly evident when working with grouped data. However, the choice between base R and dplyr depends on your preferences and needs. Base R might be the preferred route for those who prioritize simplicity and self-sufficiency.
Please reference this post in your papers or reports. Feel free to drop your suggestions, questions, or feedback in the comments below. Share this valuable resource with your peers on social media.
Resources
Here are some more dplyr tutorials on this blog:
- How to Sum Rows in R: Master Summing Specific Rows with dplyr
- Countif function in R with Base and dplyr
- Sum Across Columns in R – dplyr & base
- Row Means in R: Calculating Row Averages with Ease
- Coefficient of Variation in R