In this post, we will focus on how to calculate row means in R. Row means is a nice method to grasp trends and patterns in the data, whether we are working with surveys, experiments, or any other form of structured data. This post will explore the techniques for calculating row means using base R functions and the dplyr package.
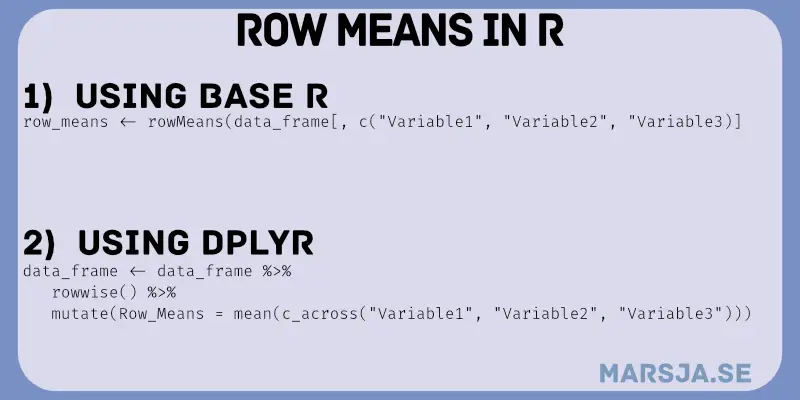
This post will guide you through the steps to harness R’s rowmeans() function and use the capabilities of dplyr for efficient and comprehensive data analysis.
Table of Contents
- Outline
- Prerequisites
- Example
- Synthetic Data
- Syntax of the rowMeans() Function
- Basic Row Means in R Using rowMeans
- Calculating Row Means for Every 5 Columns with Base R
- Row Means in R Using dplyr
- Conditional Row Means Calculation with dplyr
- Row Means in R for Every Five Columns with dplyr
- Calculate Row Averages for All Numeric Columns in R with dplyr
- How to use R & dplyr to Calculate Row Means by Group
- Base R vs. dplyr: Calculating Row Averages
- Conclusion
- Additional Resources
Outline
The structure of the post is as follows. First, we introduce the concept of calculating row means in R and briefly explain the rowMeans() function. Next, we demonstrate basic row mean calculations using rowMeans in Base R and dplyr. Afterward, we explore more complex scenarios, such as calculating row means for specific column groups, conditional row means, and row means by group using dplyr.
We also learn how to calculate row averages for all numeric columns using dplyr’s mutate_at() function. Additionally, we cover weighted row means. Furthermore, we explain the advantages of using dplyr over Base R for row mean calculations, emphasizing its flexibility and ease of use. We use synthetic data throughout the post to illustrate the concepts and provide practical examples.
Prerequisites
To effectively follow this blog post on calculating row means in R, you need a basic understanding of R. This includes knowledge of loading data into R and navigating its syntax. If you explore row means with the dplyr package, you need to have it installed. dplyr offers a toolkit for various data manipulation tasks, making it a valuable addition to your R environment. Here are some blog posts showcasing dplyr’s capabilities:
- Countif function in R with Base and dplyr
- How to Convert a List to a Dataframe in R – dplyr
- R Count the Number of Occurrences in a Column using dplyr
- How to Create Dummy Variables in R (with Examples)
Ensuring you have an updated version of R is, for example, important for using the latest features. To check your R version in RStudio, you can use the R.Version() function, which provides information about your current R installation.
If you need to update R to a newer version, visit the Comprehensive R Archive Network (CRAN) website (https://cran.r-project.org/), download the latest R installer, and follow the installation instructions. An up-to-date R environment ensures you can make the most of the functionalities discussed in this post, enhancing your data analysis capabilities. See also Update R: Keeping Your RStudio Environment Up-to-Date for using the installR package to update your R environment.
Example
Imagine that we have gathered data from participants who completed cognitive tasks designed to assess their working memory capacity and executive functioning. To add complexity, we introduced an auditory distraction in some trials to simulate real-life scenarios where individuals must maintain focus despite external interruptions.
In this example, knowing how to calculate row means in R can be very helpful. Each participant’s performance in these tasks generates a rich dataset with multiple rows of results across various conditions. The rows represent individual participants, while the columns correspond to different trials or conditions.
By computing the means of each row, we can quickly summarize each participant’s overall performance across all trials. This simplification is especially useful when we have a large dataset. For example, we can easily identify trends or patterns in, e.g., working memory capacity and executive functioning across participants. For instance, high working memory capacity tends to be related to better executive functioning, even in the presence of auditory distraction.
Moreover, calculating row means allows us to generate a compact dataset. This dataset can be used for subsequent analyses, such as correlations, regressions, or group comparisons. In this way, row means serves as a data preprocessing step, helping us learn valuable insights.
Synthetic Data
Here, we generate a synthetic dataset that can be used to practice using R to calculate row means.
# Load necessary libraries
library(dplyr)
# Set a random seed for reproducibility
set.seed(123)
# Define the number of participants
n <- 100
# Generate age data with a mean of 35 and standard deviation of 8
age <- rnorm(n, mean = 35, sd = 8)
# Generate education years data with a mean of 12 and standard deviation of 3
education_years <- rnorm(n, mean = 12, sd = 3)
# Create a correlation between age and education years
cs <- 0.9
age <- age + cs * education_years
# Simulate working memory capacity scores (continuous variable)
working_memory <- rnorm(n, mean = 50, sd = 10)
# Simulate executive functioning scores (continuous variable)
executive_functioning <- rnorm(n, mean = 60, sd = 12)
# Create a binary variable to represent the presence of auditory distraction
auditory_distraction <- sample(c(0, 1), n,
replace = TRUE,
prob = c(0.7, 0.3))
# Create a data frame
cognitive_data <- data.frame(
Participant_ID = 1:n,
Age = age,
Edu_Years = education_years,
Working_Memory = working_memory,
Executive_Functioning = executive_functioning,
Auditory_Distraction = auditory_distraction
)
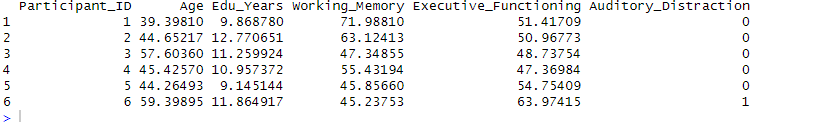
# View the first few rows of the dataset
head(cognitive_data)Code language: R (r)In the code chunk above, we loaded the necessary library: dplyr. Next, we set a random seed to ensure reproducibility of the simulated data. We then defined the number of participants, denoted as n, which is set to 100 in this instance. Additionally, we generated two demographic variables that should be correlated. Here, we used rnorm function to generate a mean age of 36 and a standard deviation of 8. For education years, we set a mean of 12 and a standard deviation of 3.
Subsequently, we simulated working memory capacity scores, which are treated as a continuous variable, using the rnorm function. These scores were generated with a mean of 50 and a standard deviation of 10. Similarly, we simulated executive functioning scores, considered a continuous variable, using rnorm. These scores were generated with a mean of 60 and a standard deviation of 12.
To incorporate the element of auditory distraction, a binary variable was created. It represents the presence (1) or absence (0) of auditory distraction during cognitive tasks. This binary variable was generated using the sample function. We used a few parameters to set the probabilities favoring a 70% chance of no distraction (0) and a 30% chance of distraction (1). We can use the sample()function for other useful data-wrangling tasks:
Finally, we combined all these variables, including Participant_ID, Working_Memory, Executive_Functioning, and Auditory_Distraction, into a single dataframe named cognitive_data. This data frame serves as the foundation for our synthetic cognitive psychology dataset.
Syntax of the rowMeans() Function
We can use R’s rowMeans function to calculate the average of rows within a matrix or data frame. This function takes the following parameters:
x: This is the matrix or data frame for which we want to calculate row means.na.rm: We use this parameter to specify whether missing values (NA) should be removed when computing row means. By default, it’s set to FALSE, meaning missing values are not removed. If set to TRUE, NA values are excluded.dims: This parameter allows us to specify the dimension along which row means should be calculated. A value of 1 (the default) indicates row-wise means, while 2 would indicate column-wise means.
Note that the rowMeans() is similar to rowSums() and colSums(). See these posts for more information about these functions:
- How to Sum Rows in R: Master Summing Specific Rows with dplyr
- Sum Across Columns in R – dplyr & base
This post will explore various examples to illustrate how the rowMeans function can be applied effectively, allowing us to gain insights and perform calculations on real-world data.
Basic Row Means in R Using rowMeans
We can use base R to get the row means:
# Calculate row means for the 'cognitive_data' dataset
row_means <- rowMeans(cognitive_data[, c("Working_Memory",
                                         "Executive_Functioning",
                                         "Auditory_Distraction")])

# Create a new column 'Row_Means' to store the calculated means
cognitive_data$Row_Means <- row_meansCode language: PHP (php)
In the code example above, we used the rowMeans function from base R to calculate row means. We selected specific columns (Working_Memory, Executive_Functioning, and Auditory_Distraction) for the calculation. The resulting row means were stored in a new column named ‘Row_Means‘ within the dataset. Using base R functions, this simple method provides a straightforward way to compute row means in R.
Calculating Row Means for Every 5 Columns with Base R
Calculating row means for every 5 columns using R is useful when we have a large dataset with regularly spaced variables and want to compute row means efficiently. Here is an example using base R:
# Calculate row means for every 5 columns in 'cognitive_data'
row_means <- rowMeans(cognitive_data[, 2:6], na.rm = TRUE)
# Create a new column 'Row_Means' to store the calculated means
cognitive_data$Row_Means <- row_means
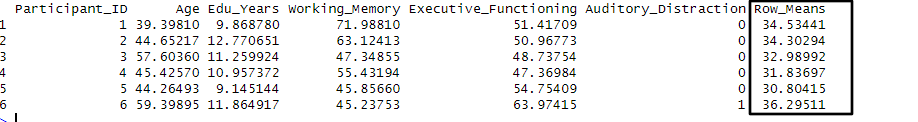
# View the first few rows of the updated dataset
head(cognitive_data)Code language: PHP (php)In the code chunk above, we used base R to calculate row means for every 5 columns. We selected the variables of interest by specifying the column indices (2:6). The na.rm = TRUE argument ensures that any missing values in the selected columns are ignored during the calculation. The resulting row means were stored in a new column named ‘Row_Means‘ within the dataset. This method allows us to compute row means efficiently for specific sets of columns in our data. Note that for the synthetic data, calculating row means for every 5th column does not really make sense.
Row Means in R Using dplyr
Calculating row means in R using the dplyr package provides a convenient and efficient approach. Here, we will use dplyr to calculate row means for the example data.
# Load the dplyr library
library(dplyr)

# Calculate row means for the cognitive variables
cognitive_data <- cognitive_data %>%
  rowwise() %>%
  mutate(Row_Means = mean(c_across(c(Working_Memory,
                                     Executive_Functioning,
                                     Auditory_Distraction)), na.rm = TRUE))

# View the first few rows of the updated dataset
head(cognitive_data)
Code language: PHP (php)
In the code snippet above, we used the dplyr package to calculate row means. We first loaded the library and used the %>% (pipe) operator to chain operations together. Inside the mutate() function, we employed the rowwise() function to specify row-wise operations and the mean(c_across()) function to calculate the row mean the cognitive data. The na.rm = TRUE argument ensures that missing values are handled appropriately.
Conditional Row Means Calculation with dplyr
To calculate row averages based on a condition in R using the dplyr package, we can use its powerful filtering and data manipulation capabilities. Let us look at an example:
# Load the dplyr library
library(dplyr)

# Calculate row averages for 'Working_Memory' and 'Executive_Functioning'
# columns only when 'Auditory_Distraction' is 1
conditional_row_means <- cognitive_data %>%
  filter(Auditory_Distraction == 1) %>%
  rowwise() %>%
  mutate(Conditional_Row_Means = mean(c(Working_Memory, Executive_Functioning), na.rm = TRUE))

# View the first few rows of the updated dataset
head(conditional_row_means)Code language: R (r)
In the code chunk above, we used the filter() function to select rows where Auditory_Distraction equals 1. Then, we applied the rowwise() function and calculated the row averages for the Working_Memory and Executive_Functioning columns. The na.rm = TRUE argument ensures that the calculation appropriately handles missing values. This approach allows us to conditionally calculate row means based on specific criteria.
Row Means in R for Every Five Columns with dplyr
We can efficiently manipulate the data to calculate row means in R for every five columns using the dplyr package. Here is how:
# Load the dplyr library
library(dplyr)

# Select every 5th column and calculate row means
row_means_five_columns <- cognitive_data %>%
  select(seq(1, ncol(cognitive_data), by = 5)) %>%
  rowwise() %>%
  mutate(Row_Means_Five_Columns = mean(c_across(everything()), na.rm = TRUE))

# View the first few rows of the updated dataset
head(row_means_five_columns)Code language: PHP (php)
In the code snippet above, we utilized the select() function together with seq(). Within the seq() function, we used the ncol() function to determine the total number of columns in the dataset. We did this to choose every 5th column in the dataset. Then, we used rowwise() to calculate the row means using the mutate() function. Moreover, c_across(everything()) allowed us to apply the mean function to all selected columns for each row and na.rm = TRUE handles any missing values in the calculation. Here is a blog post about using seq()to generate sequences of numbers:
This approach is useful when we want to analyze data with specific column groupings or when we need to compute row means for a subset of our dataset.
Calculate Row Averages for All Numeric Columns in R with dplyr
To use R to calculate row means for all numeric columns, we can modify
# Calculate row averages for all numeric columns using dplyr
result_df <- original_df %>%
  rowwise() %>%
  mutate(Row_Average = mean(c_across(where(is.numeric)), na.rm = TRUE))

# View the resulting dataframe
head(result_df)Code language: PHP (php)
In the code chunk above, we used the mutate() function from the dplyr package along with across() and rowMeans() functions. We used the across() function to select columns based on a condition. In this case, we selected all numeric columns using where(is.numeric). Then, within rowMeans(), we calculated the row averages for these selected numeric columns. The results were added as a new column named Row_Averages in the dataset, providing a quick and efficient way to compute row averages for all numeric variables.
How to use R & dplyr to Calculate Row Means by Group
Here is how we can use group_by()from dplyr to calculate row averages by group:
# Load necessary library
library(dplyr)

# Create two groups based on median split of Working Memory
cognitive_data <- cognitive_data %>%
    mutate(Group = ifelse(Working_Memory >= median(Working_Memory), "High", "Low"))

# Calculate row means by groups
row_means_by_group <- cognitive_data %>%
    group_by(Group) %>%
    rowwise() %>%
    mutate(Row_Mean = mean(c(Working_Memory, Executive_Functioning)))

# View the first few rows of the dataset with row means by groups
head(row_means_by_group)Code language: PHP (php)
In the code chunk above, we first created two groups (High and Low) based on a median split of the Working_Memory variable. This grouping is created only for practicing.
Importantly, we used the group_by function to group the data by the Group variable. This allowed us to calculate row means separately for each group. Inside the mutate function with rowwise, we calculate the row mean of Working_Memory and Executive_Functioning for each observation within their respective groups.
The resulting dataset, row_means_by_group, includes the original variables, the Group variable, and a new variable Row_Mean representing the row means for each observation within their respective groups. Finally, this approach is useful when comparing row means between different groups within our data.
Base R vs. dplyr: Calculating Row Averages
In data analysis, flexibility and simplicity often go hand in hand. We can calculate row averages in both Base R and dplyr, but dplyr offers a more versatile and intuitive approach. First, with dplyr, selecting specific columns in R for row means it is easier to use helper functions like contains(), starts_with(), and match(). Moreover, we can streamline the process by chaining multiple actions and enhancing code readability and maintainability. Finally, we get similar functionality with Base R, but dplyr offers a more user-friendly experience, especially when working with large datasets.
Conclusion
In this post, we have covered various aspects of calculating row means in R, offering a comprehensive guide for data analysts and R users. We introduced the rowMeans() function and its syntax, providing a strong foundation for further exploration. Through a series of examples, we demonstrated how to calculate row means efficiently using both Base R and dplyr, catering to different preferences and needs.
From basic row mean calculations to more advanced techniques such as conditional row means, and group-based calculations, we have showcased the versatility of R for this task. Whether you prefer the simplicity of Base R or the flexibility of dplyr, you now have various tools to handle diverse data analysis scenarios.
We also highlighted the advantages of dplyr, emphasizing its efficiency in selecting numeric columns and performing operations on them. Additionally, we touched upon calculating row averages for numeric columns with ease, simplifying data manipulation tasks.
I hope this post has equipped you with the knowledge and skills to compute row means effectively in R. If you have any suggestions, corrections, or specific topics you would like me to cover in future blog posts, please feel free to comment below. Your feedback is valuable, and I look forward to hearing from you. Remember to share this post on your favorite social media platforms to help others on their data analysis journey.
Additional Resources
- Coefficient of Variation in R
- Fisher’s Exact Test in R: How to Interpret & do Post Hoc Analysis
- How to Rename Factor Levels in R using levels() and dplyr
- Cronbach’s Alpha in R: How to Assess Internal Consistency
- Probit Regression in R: Interpretation & Examples
- How to Add a Column to a Dataframe in R with tibble & dplyr