In this post, you will learn how to report correlation in APA style. Adhering to APA (American Psychological Association) guidelines is important when you report your analysis and write your results. Whether you are conducting research in psychology, cognitive science, or a related field, APA style is often required by journals and conferences. This post will provide a step-by-step guide on reporting correlation in APA style using R, including creating tables.
To report correlation in APA style, we can follow a specific template that includes the correlation method, sample size, degrees of freedom, correlation coefficient value, and p-value. APA 7th edition also recommends reporting confidence intervals for correlation coefficients. In R, we can use functions such as cor.test() to obtain these statistics for Pearson’s r and other correlation methods. Here is how we can report Pearson’s product-moment correlation coefficient according to APA:
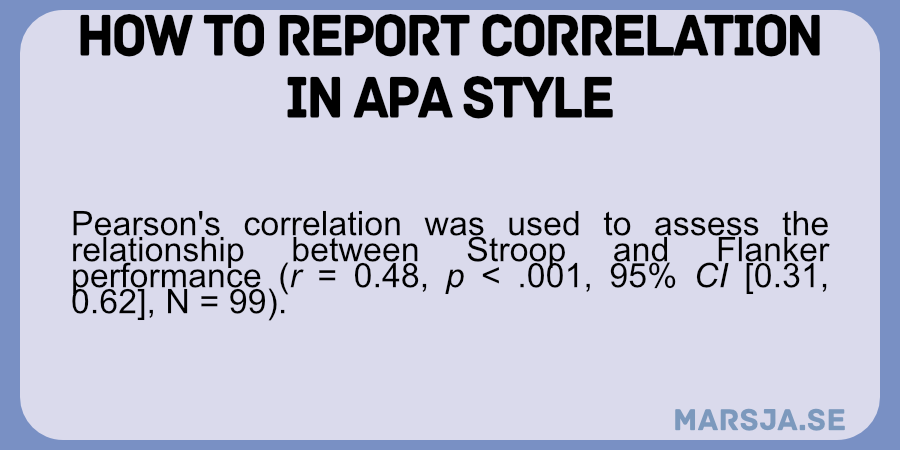
Table of Contents
- Outline
- R Packages for Reporting Correlation Results
- Requirements
- Data
- How to Report Correlation Results in APA 7
- How to Report Correlation Results in APA Style using R
- APA Format Correlation Table using apaTables
- How to Report Correlation Results in a APA-Formatted Table in R
- apaTables vs. rempsyc
- Conclusion: Reporting Correlation Results in APA Style with R
- Resources
Outline
The outline of this post is to provide you with a comprehensive guide to reporting correlation results in APA style using R. Before how to report according to APA, we will discuss the requirements, including installing several R packages. Next, we will create synthetic data and look at how to report correlation results for Pearson’s correlation (r), Spearman’s Rho, and Kendall’s Tau. Here, we will provide APA templates for each correlation type and explain how to create a correlation matrix in R.
In the following section, we will guide you through reporting Pearson’s, Spearman’s, and Kendall’s correlation coefficients in APA 7 style using R. We will also show you how to create a correlation table in APA format using the apaTables and rempsyc packages. We will also walk you through the four steps to create an APA-formatted table in R: loading the packages, creating a correlation matrix, calculating and adding mean and standard deviation, and creating the table itself. By the end of the post, you’ll have the tools and knowledge to confidently report your correlation results in APA style. Finally, we will compare apaTables and rempsyc for creating APA tables, highlighting some of the pros and cons of each.
R Packages for Reporting Correlation Results
There are several R packages available that can help us report our results in APA style. One such package is the apaTables package, which provides functions for creating APA-style tables of descriptive statistics, ANOVA results, and correlation matrices. In this post, we will use the apaTables and rempsyc packages. We will also use the report package. This package is also useful for creating APA-style reports, including tables, figures, and statistical analyses. Note that the package is part of the easystats packages, a set of very helpful packages (e.g., correlation). Another useful package is papaja, which allows researchers to write APA-style manuscripts in RMarkdown format. Other packages that can be helpful for APA-style reporting include ggplot2 and dplyr. With these packages and others like them, researchers can easily generate high-quality reports and manuscripts that meet APA style guidelines.
Requirements
To follow this blog post, you should know basic R programming concepts, such as data manipulation, syntax, and regular expressions. Additionally, you will need to have some packages installed, including tidyverse, report, corrr, apaTables, and rempsyc.
To install the packages, you can use the install.packages() function followed by the package name within quotation marks. For example, to install tidyverse, you can type install.packages("tidyverse") into the console.
If you plan to use apaTables, you may only need to install that package, as it includes many other necessary packages. However, if you plan to use rempsyc, you must install all the required packages separately. Note it is also recommended that you update R to the latest version.
In this blog post, we will be using tidyverse packages such as dplyr, magittr, and tidyr, to manipulate data. We will also be using the corrr package to create a correlation matrix. Finally, we will use the rempsyc package to create an APA-formatted table of the correlation results.
Data
Here is an example dataset we can use to practice reporting and creating correlation tables following APA 7 style in R:
library(MASS)
library(dplyr)

set.seed(20230507)

# Generate correlation matrix for Span variables
cor_span <- matrix(c(1, 0.6, 0.45,
                     0.6, 1, 0.55,
                     0.45, 0.55, 1), ncol = 3)

# Generate correlation matrix for Effect variables
cor_effect <- matrix(c(1, 0.47, 0.45,
                       0.47, 1, 0.39,
                       0.45, 0.39, 1), ncol = 3)

# Generate Span variables
span_vars <- as.data.frame(mvrnorm(100, mu = c(0, 0, 0), Sigma = cor_span)) %>%
  rename(OSpan = V1, RSpan = V2, DSpan = V3)

# Generate Effect variables
effect_vars <- as.data.frame(mvrnorm(100, mu = c(0, 0, 0), Sigma = cor_effect)) %>%
  rename(Stroop = V1, Flanker = V2, Simon = V3)

data <- cbind(effect_vars, span_vars) %>% as_tibble()

# Modify the Span variables to have a higher correlation with Effect variables
data <- data %>% mutate(OSpan = 0.25 * Stroop + OSpan * 0.75,
                    RSpan = 0.25 * Flanker + RSpan * 0.75,
                    DSpan = 0.25 * Simon + DSpan * 0.75)Code language: R (r)
In the code chunk above, we generated two correlation matrices using the matrix function. The first matrix was for the three Span variables, and the second was for the three Effect variables. We then used the mvrnorm function from the mvtnorm package to generate 100 observations for each of the variables. We assigned these observations to separate data frames using as.data.frame and then used rename from the dplyr package to give them meaningful names.
To create the correlation between the Working Memory Capacity and Inhibition variables, we used the mutate function from dplyr to modify the Working Memory Capacity variables. We multiplied each variable by 0.75 and added 0.25 times the corresponding Effect variable. This gave us Span variables that were moderately correlated with the Effect variables, with correlation coefficients ranging from 0.14 to 0.31.
In the code chunk, we used the MASS and dplyr packages to generate and manipulate data for six variables with different correlation structures, allowing for the simulation of complex relationships between variables commonly used in cognitive psychology research. Here is a quick overview of the data:
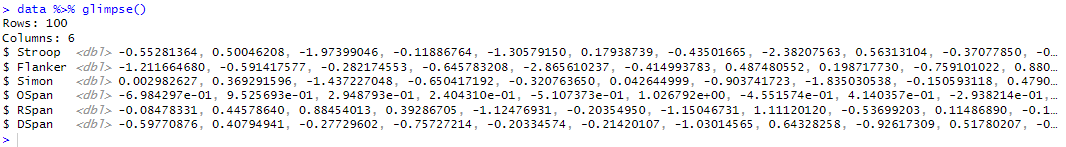
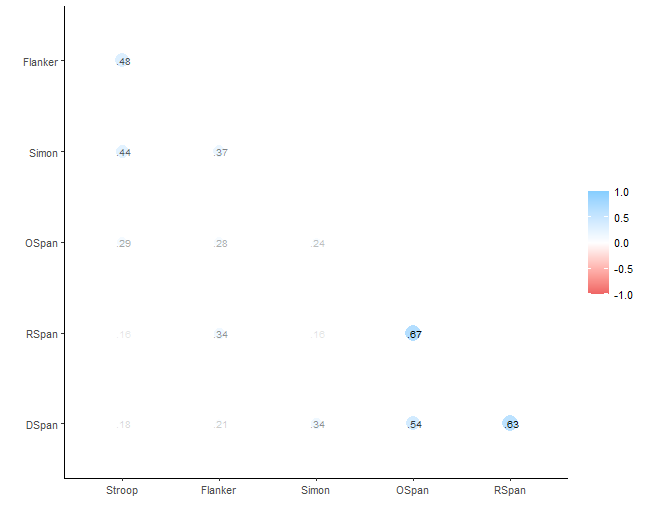
Here we get a quick view of how the variables are correlated:
In the next section, we will provide a detailed step-by-step guide on obtaining and reporting correlation statistics in APA style using R, along with examples of how to customize the output to meet specific requirements.
How to Report Correlation Results in APA 7
This section provides text templates for reporting Pearson’s r, Spearman’s Ρ, and Kendall’s Τ in APA style. These templates can be used to report the results of correlation analyses in research articles, theses, and dissertations.
Template for Reporting Pearson’s Correlation (r) in APA Style:
Here is a template you can use to report Pearson’s correlation according to APA 7:
Pearson’s correlation was used to assess the relationship between [Variable X] and [Variable Y] (r = [correlation coefficient], p < [p-value], 95% CI [lower bound, upper bound], N = [sample size]).
Template for Reporting Spearman’s Rho in APA Style:
Here is a template you can use to report Spearman’s correlation in APA.style:
Spearman’s rho was used to assess the relationship between [Variable X] and [Variable Y] (ρ = [correlation coefficient], N = [sample size], p < [p-value].
Template for Reporting Kendall’s Tau in APA Style:
Here is how you can report Kendall’s Tau using APA style:
Kendall’s tau-b was used to assess the relationship between [Variable X] and [Variable Y] (τ_b = [correlation coefficient], p < [p-value].
In the next section, we will look at how we can use the R package report for reporting correlation results according to APA format.
How to Report Correlation Results in APA Style using R
Here is how to calculate Pearson’s product-moment correlation coefficient in R and use the report()function:
library(report)
library(magrittr)

# Pearson's Correlation Coefficent:
results.r <- data %$%
  cor.test(x = Stroop, y = Flanker)

report(results.r)Code language: HTML, XML (xml)
In the code chunk above, we used the library function to load the report and magrittr packages into our R environment.
Next, we used the %$% operator from the magrittr package to avoid repeatedly referring to the dataframe we are working with. Then, we used the cor.test function to calculate the Pearson’s correlation coefficient between the Stroop and Flanker variables in our data frame.
Finally, we passed the output of cor.test to the report function to generate a report of the correlation analysis. Here is the output:

Report Pearson’s Correlation APA
As you can see, it is not how we should report correlation according to APA. We need to adjust the output from the report() function:
#| results: asis
# Store the original report output in a variable
report_output <- report(results.r) %>%
  # Remove the first sentence
  summary()

# Italicize the statistical letters:
report_output <- gsub("\\b(r|CI|t|p)\\b", "*\\1*", report_output)

# Print the output
report_outputCode language: PHP (php)
In the code chunk above, the report generated using results.r is stored in report_output variable. Then, the summary() function removes the first sentence from the report. Finally, gsub() function is used to italicize the statistical letters, which are identified using the regular expression \\b(r|CI|t|p)\\b. Note that “|” means “or” in R.

As you can see, it does not entirely follow our previous templates, but it will do.
Reporting Spearman’s Correlation APA 7 Style with R
Here is another example of how we can use R to report correlation results in APA style:
# Spearman's Rho
results.r <- data %$%
  cor.test(x = Stroop, y = Flanker, method = "spearman")

# Store the original report output in a variable
report_output <- report(results.r) %>% summary()


# extract sample size from data
n <- dim(data)[1]

# generate new report text
report_output <- gsub("rho = ", "*r~s~* = ", report_output) %>%
               gsub(", S = [0-9]+\\.[0-9]+", "", .) %>%
               gsub("\\)", paste0(", *n* = ", n, ")"), .) %>%
   gsub("\\b(p)\\b", "*\\1*", .) %>%
  # Swapping places on n = 100 and p ... :
  gsub("([*][a-z][*]\\s*[<>~=]\\s*[.0-9]+)([,]\\s*)([*][n][*]\\s*[=]\\s*[0-9]+)", "\\3\\2\\1", .)


# print report
report_outputCode language: R (r)
In the code chunk above, the function gsub() is used to modify the report text generated from report() function. We use gsub() to replace “rho =” with “rs =” in the report_output variable. Next, we remove “, S = [0-9]+\.[0-9]+” using regex from the report_output. The third gsub() replaces the closing parenthesis in report_output with “, n = {sample size})” using n extracted from the data. We use gsub() a fourth time to italicize the letter “p” in report_output. Finally, the fifth gsub() swaps the places of “n = {sample size}” and “p {comparison} {value}” in report_output using regex.
Kendall’s Tau Correlation Results APA Style
Here is a third example. Here we report Kendall’s Tau according to APA style:
# Spearman's Rho
results.r <- data %$%
  cor.test(x = Stroop, y = Flanker, method = "kendal")

# Store the original report output in a variable
report_output <- report(results.r) %>% summary()

# generate new report text
report_output <- gsub("tau = ", "*r~τ~* = ", report_output) %>%
               gsub(", z = [0-9]+\\.[0-9]+", "", .) %>%
   gsub("\\b(p)\\b", "*\\1*", .)


# print report
report_outputCode language: PHP (php)
In the code chunk above, we compute Kendall’s tau correlation coefficient. Using gsub(), we first replace “tau =” with “rτ =” in report_output. Then, we remove “, z =” and the corresponding value from report_output using another gsub(). Lastly, we italicize “p” using a third gsub(). All of these operations are done using the pipe operator. Here is the generated text that follows reporting correlation (Kendall’s tau) in APA style:
Now that we know how to report correlations according to APA 7 using R, we can also utilize R Markdown to create APA-style tables. To create these tables, we need to generate a correlation matrix. This will allow us to easily view all the correlations in our dataset and report them clearly and concisely. Using R and RMarkdown, we can streamline the process of creating APA tables and ensure they meet the necessary formatting guidelines.
APA Format Correlation Table using apaTables
Here is how to get APA correlation table in R:
library(apaTables)
apa.cor.table(data, filename = "APA_Correlation_Table.doc",
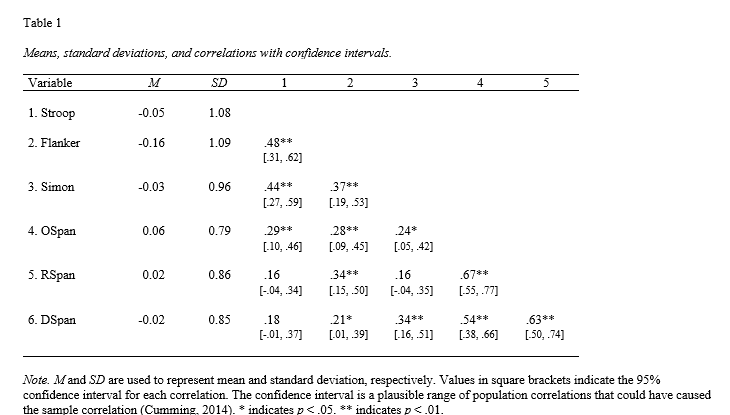
table.number=1)Code language: R (r)In the code chunk above, we use the apaTables package to create an APA-style correlation table.
The apa.cor.table() function takes in our data object and generates a correlation matrix according to APA 7 guidelines.
We specify the filename argument to save the table in a Word document named “APA_Correlation_Table.doc”. Additionally, we specify the table.number argument to set the table number as “Table 1”.
That was simple. These few lines of code will create an APA 7-compliant correlation table in R and save it to a Word document for reporting and analysis purposes. Here is the output:
In addition, it is worth mentioning that apaTables is not only capable of creating APA-style correlation tables but also ANOVA tables, regression tables, and more. However, a drawback of using apaTables is that the output can only be saved as Word files and cannot be easily included in PDF or HTML reports. Therefore, we will look at how to use the rempsyc package to report correlation results in an APA formatted table.
How to Report Correlation Results in a APA-Formatted Table in R
Here are the steps for creating an APA 7 formatted correlation matrix using the nice_table() function from the rempsyc package:
1: Load the Packages
First, we need to load the corrr and rempsyc packages:
library(rempsyc)
library(corrr)
2: Create a Correlation Matrix in R
Next, we will create the correlation matrix using correlate():
# Compute correlation matrix
corr_mat <- data %>%
    correlate(data) %>%
  # Remove the the last column of the correlation matrix
   # select(-last_col()) %>%
  # Upper triangle removed (filled with NA)
    shave()Code language: PHP (php)
In the code chunk above, we are computing a correlation matrix using the correlate() function from the corrr package. Next, we remove the first row and last column of the correlation matrix using slice() and select() functions. Finally, we remove the upper triangle of the matrix and replace those values with NAs using shave(). Note how we used the dplyr’s select() to remove a column in R. In the following step, we will calculate and add the mean and the standard deviation to the dataframe.
3: Calculate and add Mean and Standard Deviation
The third step is to calculate and add mean and standard deviation to the correlation matrix:
corr_tab <- data %>%
  # Calculate mean and standard deviation
    summarise_if(is.numeric, list(M = mean, SD = sd)) %>%
  # Transform the data from wide to long:
    tidyr::pivot_longer(cols = everything(),
                        names_sep = "_", names_to = c("term", "Stat")) %>%
  # To keep the order we change term to factor
  mutate(term = factor(term, levels = unique(term))) %>%
  # Spread the data so we have two columns: mean and sd
    tidyr::spread(Stat, value)

# Now we add the correlation matrix
corr_tab <- left_join(corr_tab, corr_mat, by = "term") %>%
  # Remove the last column
  select(-last_col()) %>%
  # And round the numeric values
  mutate_if(is.numeric, round, digits = 2)Code language: PHP (php)
In the code chunk above, we first calculate the mean and standard deviation of the dataset. Next, we transform the data from wide to long format using pivot_longer(). We separate the variable names into two columns: “term” and “Stat”. To maintain the order of the variables in the long format, we change the “term” column to a factor with unique levels. Then, we spread the data to have two columns: “mean” and “sd”. After that, we add the correlation matrix to the table using left_join() and by = "term". Finally, we remove the last column of the table using select(-last_col()) and round.
4: Create the APA Table in R
Here is how to use the nice_table() function to generate an APA-formatted correlation table in R:
corr_table_apa <- corr_tab %>%
  rename(Variable = term) %>%
  # Create the table with rempsyc nice_table
  nice_table(
    italics = 2:3,
    title = c("Table 1", "Means, standard deviations, and correlations"),
    note = "M and SD are used to represent mean and standard deviation, respectively"
)Code language: PHP (php)
In the code chunk above, we create an APA-formatted correlation table using the rempsyc package’s nice_table function. First, we rename a column to “Variable” with rename(). Then, we use nice_table() to create the table. We set the second and third columns (mean and standard deviation) to be in italics using italics = 2:3. We add a title and a note with the title and note arguments, respectively. The note specifies that “M” and “SD” are used to represent mean and standard deviation.
We can also save the APA formatted table in R a .docx file:
# Save table to word
mypath <- tempfile(fileext = ".docx")
flextable::save_as_docx(corr_table_apa, path = mypath)Code language: PHP (php)
As you may have noticed, we had to write more code than when using the apaTables package.
apaTables vs. rempsyc
apaTables is a straightforward package with a single function for creating APA-style tables. It allows for the quick and easy creation of tables and is useful for those who do not want to spend a lot of time customizing their tables. However, the downside of apaTables is that it only works for creating Word documents, not PDFs.
In contrast, rempsyc requires more coding but provides many table customization options. rempsyc can create tables in both Word and PDF formats, making it a more versatile option. Additionally, rempsyc includes several functions for creating tables with descriptive statistics, regression results, and more. However, as you have seen above, we would have to calculate the confidence interval when using rempsyc.
In summary, apaTables is a good option for those who want a quick and easy solution for creating simple APA-style tables in Word documents. However, if you need more customization options or want to create tables in PDF format, rempsyc might be a better choice despite requiring more coding.
Conclusion: Reporting Correlation Results in APA Style with R
This blog post covered different R packages and templates for reporting correlation results in APA style. It also explained the requirements for following the post, including basic R knowledge and installing necessary packages. The post demonstrated how to report Pearson’s r, Spearman’s rho, and Kendall’s tau correlation results. It also showed how to create an APA-formatted table using the apaTables package and customize a table using rempsyc. The post outlined the steps for creating a correlation matrix, adding mean and standard deviation, and creating an APA table.
While apaTables offers a simple solution for creating an APA-formatted table, it cannot be saved as a PDF. In contrast, rempsyc provides more customization options but requires more coding.
To conclude, this blog post provided a comprehensive guide for reporting correlation results in APA style using R. If you found this post helpful, please share it on social media and leave a comment to let us know your thoughts.
Resources
Here are other resources you might find helpful:
- How to Convert a List to a Dataframe in R – dplyr
- Papaja – APA manuscripts made easy
- R Count the Number of Occurrences in a Column using dplyr
- Countif function in R with Base and dplyr
- How to Make a Residual Plot in R & Interpret Them using ggplot2
- Plot Prediction Interval in R using ggplot2
- How to Standardize Data in R
- Sum Across Columns in R – dplyr & base
- How to use %in% in R: 8 Example Uses of the Operator
- How to Calculate Z Score in R

In your code, you load dplyr before MASS, so there is a namespace conflict for `select()` later on. It would be better to load MASS, then dplyr, else users might not know why the code is not working for them 🙂
“` r
library(dplyr)
library(MASS)
#> Attaching package: ‘MASS’
#> The following object is masked from ‘package:dplyr’:
#>
#> select
# Now we add the correlation matrix
corr_tab
select(-last_col())
#> Error in select(mtcars, -last_col()): unused argument (-last_col())
“`
Created on 2023-05-09 with [reprex v2.0.2](https://reprex.tidyverse.org)
Hey Rémi,
Thank you for your comment. You are right. I forgot to flip that after noticing that error myself. I have now updated the code chunk. By the way, thanks for a great package (or packages, I should say. I also use lavaanExtra).
Best,
Erik
You are welcome! Thanks for featuring my work and for this thorough comparison on generating formatted correlation tables. It will be a good reference for everyone looking into this matter.