In data analysis, understanding how to add a column to a matrix in R is an important skill that will let you to precisely manipulate, transform, and enhance your data. This guide will walk you through expanding your matrices’ capabilities by adding new columns. Whether you want to enrich your data with additional variables, perform complex calculations, or organize your matrix effectively, mastering this technique may be important.
In this post, we will explore the step-by-step approach to adding columns to matrices in R. We will also get into the significance of assigning meaningful names to those columns for a comprehensive understanding of your data. We will touch upon various aspects, including how to add values to a column in matrix R and how to add column names to a matrix in R. By the end, you will be equipped with the knowledge and skills to effortlessly expand the capabilities of your matrices and perform advanced data analysis in R.
Table of Contents
- Outline
- Understanding Matrices in R
- Creating a Matrix in R
- How to Add a Column to a Matrix in R
- Working with Matrix Columns
- Adding Names to Matrix Columns
- More Practical Examples of Adding Columns to a Matrix in R
- Advanced Techniques
- Conclusion: How to Add a Column to a Matrix in R
- Resources
Outline
The outline of this post provides a structured approach to comprehending matrices in R, starting with the basics. We will explore the fundamental aspects of matrices, discussing their creation, structure, and generation. Once we have a solid understanding of matrices, we will add new columns. This section will guide you step by step, equipped with practical examples.
Subsequently, we will explore working with matrix columns, demonstrating how to extract, modify, and perform calculations on columns. An understanding of these operations is pivotal for data manipulation.
Our journey will then lead us to the significance of column names. This section highlights the importance of naming columns and provides instructions on effectively assigning these names, ensuring clarity and organization.
To deepen our knowledge, we will have a look at real-world applications. Through practical examples, we will illustrate the process of adding columns, including examples from cognitive psychology research and hearing science measurements, to emphasize the versatility of these techniques in various fields.
Lastly, advanced techniques like reshaping and transposing matrices will be explored. These skills can be invaluable when dealing with complex data structures and analysis.
Understanding Matrices in R
In data analysis with R, matrices are an important component. These rectangular data arrangements are fundamental structures that store and manipulate information efficiently. To harness the full potential of matrices for data analysis, you must first understand their significance.
Matrices serve as the backbone for a wide range of data manipulation tasks in R. You will find them particularly valuable when working with structured data sets, as they provide a concise way to organize and analyze information. A matrix consists of rows and columns, where each cell holds a data point. It is essential to comprehend the basic structure of matrices, the distinction between rows and columns, and how these components interplay in data analysis.
Creating a Matrix in R
Creating matrices from scratch is a fundamental skill in R, especially when working with datasets. It allows you to define the structure of your data, setting the stage for various data analysis tasks. This section will get into creating matrices in R, providing you with the essential know-how.
Defining the Matrix Structure
To create a matrix in R, you need to specify its structure, which includes the number of rows and columns. The function used for this purpose is matrix(). The basic syntax is as follows:
matrix(data, nrow, ncol, byrow = FALSE)Code language: PHP (php)In the code chunk above, data represents the elements you want to populate the matrix with while nrow and ncol are the desired number of rows and columns, respectively. We can use the optional byrow argument set to TRUE to fill the matrix by rows. On the other hand, if FALSE or omitted, it fills the matrix by columns.
Generate a Matrix
Let us put this into practice with an example. Suppose you have a data vector and want to create a 3×2 matrix with these values. You can do this as follows:
# Define the data vector
data_vector <- c(1, 2, 3, 4, 5, 6)

# Create a 3x2 matrix from the data
matrix_from_vector <- matrix(data_vector, nrow = 3, ncol = 2)Code language: PHP (php)
In the code chunk above, we start by defining a data vector data_vector that contains six numeric values. We then use the matrix() function in R to create a 3×2 matrix called matrix_from_vector. This function reshapes the data vector into a matrix with three rows and two columns. Each vector element is placed sequentially in the matrix, filling the rows from left to right and top to bottom.
This code is a simple example of creating a matrix in R by specifying the number of rows and columns you desire. In the next section, we will learn how to add a new column to a matrix in R.
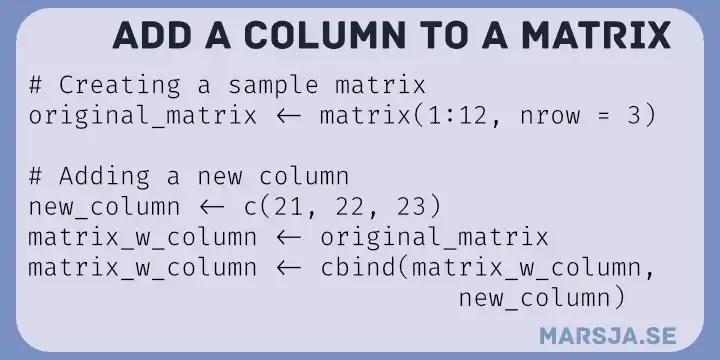
How to Add a Column to a Matrix in R
Expanding or altering your matrix in R is a common requirement when working with data. One frequent operation is adding a new column to an existing matrix. This section provides a step-by-step guide on performing this task and practical examples.
Step-by-Step Guide to Adding a New Column
To add a new column to a matrix in R, we will first need to create the data you want to include in the column. Once you have the data, follow these steps:
- Create the Data: Generate the data you want to add as a new column. This data should have the same number of rows as your matrix.
- Use cbind(): To combine our matrix and the new data column, we can use the
cbind()function. Here is the basic syntax:
new_matrix <- cbind(existing_matrix, new_data)Code language: R (r)In this syntax, existing_matrix is the matrix to which you want to add a new column and new_data is the data we have generated. See also these posts about adding columns to R’s dataframe object:
- How to Add a Column to a Dataframe in R with tibble & dplyr
- R: Add a Column to Dataframe Based on Other Columns with dplyr
- How to Add an Empty Column to a Dataframe in R (with tibble)
Practical Examples of How to Add a New Column to a Matrix in R
Let us illustrate the process with an example. Suppose we have an existing matrix and want to add a column of scores on a psychological test.
# Create a matrix with example psychological data
psych_matrix <- matrix(c(75, 80, 90, 68, 55, 72), ncol = 2)

# Generate new data representing test scores
new_scores <- c(5, 4, 3)

# Add a new column with the new test scores to the psychological matrix
psych_matrix_with_scores <- cbind(psych_matrix, new_scores)Code language: R (r)
In the code snippet above, we have an example related to psychological research. We start with a matrix called psych_matrix that represents test scores of individuals in two different conditions. Each row corresponds to a participant, and the two columns represent their test scores. To extend our analysis, we generate new data for an additional test condition and store it in the vector new_scores. We then use the cbind() function to add a new column with these scores to the existing psychological matrix, creating psych_matrix_with_scores. This is a simplified example of how researchers might manage and analyze test data for different conditions in a psychological study.
# Create a matrix with data
psych_data <- matrix(c(3, 5, 7, 4, 8, 6), ncol = 2)

# Generate new data for two additional conditions
new_condition1 <- c(9, 2, 5)
new_condition2 <- c(6, 3, 1)

# Add two new columns to the data matrix
psych_data_with_conditions <- cbind(psych_data, new_condition1, new_condition2)
Code language: PHP (php)
In the code snippet above, we work with participant performance data in two conditions. The matrix psych_data consists of two columns representing test scores in these conditions. To further analyze this data, we generate new data for two additional experimental conditions: new_condition1 and new_condition2. These new data vectors represent test scores in two different conditions. We then use the cbind() function to add both new columns to the existing psychological data matrix, resulting in psych_data_with_conditions. This example showcases expanding a dataset in psychological research when considering multiple experimental conditions.
Working with Matrix Columns
Matrix columns are fundamental elements in data analysis and manipulation. This section covers common operations and manipulations related to matrix columns. You will be well-equipped for various data analysis tasks by understanding these operations.
Working with matrix columns is essential when performing specific data transformations, calculations, or subset data based on particular variables. Here, we will discuss some of the most common operations, including extracting, modifying, and calculating columns.
Extracting Columns
To extract specific columns from a matrix, you can use indexing. For instance, if you have a matrix named my_matrix and you want to extract the first column, you can do so as follows:
first_column <- my_matrix[, 1]Code language: CSS (css)In the code chunk, we extracted the first column. We can extract the necessary columns by specifying the column number within square brackets. This operation is invaluable when we want to work with specific data subsets.
Modifying Columns
We can also modify matrix columns to make updates or transformations. For example, if you want to replace values in a column, you can do it as follows:
my_matrix[, 2] <- my_matrix[, 2] * 2Code language: CSS (css)In the code chunk above, we are doubling all values in the second column of the matrix.
Calculating on Columns
Performing calculations on matrix columns is common in data analysis. We can compute column sums and means or apply custom functions. Here is how to calculate the mean of each column:
# Calculate the mean of each column in the matrix
column_means <- colMeans(my_matrix)Code language: R (r)
In the code chunk above, we utilized the colMeans() function to compute the means of each column within the matrix my_matrix. This is a common operation in data analysis, especially in psychology, where you might have data collected from various participants, and we want to determine the average values for each variable or condition across these participants.
In data analysis, working with matrix columns is a fundamental skill. Understanding how to extract, modify, and calculate on columns empowers you to perform diverse data operations and derive insights from your datasets.
Adding Names to Matrix Columns
Adding names to matrix columns is a crucial aspect of data analysis, for example, in cognitive psychology and hearing science. This section explores the importance of assigning names to matrix columns and provides instructions in R.
The Importance of Column Names
Column names provide a human-readable reference to the variables contained within a matrix. In the context of cognitive psychology and hearing science, these names are often linked to specific measurements, parameters, or experimental conditions. Having descriptive column names makes your data more interpretable and user-friendly.
When conducting research in cognitive psychology, for instance, column names could represent variables such as reaction_time, response_accuracy, or stimulus_condition.
Assigning Column Names
In R, we can assign names to matrix columns using the colnames() function. Here is how we can add names to a matrix in R:
# Create a matrix
my_matrix <- matrix(1:12, nrow = 4)

# Assign column names
colnames(my_matrix) <- c("Subject_ID", "Reaction_Time", "Response_Accuracy", "Stimulus_Condition")

# View the matrix with column names
my_matrixCode language: R (r)
In the code above, we first create a matrix and then use colnames() to assign descriptive column names. In this way, the matrix becomes more informative and contextually meaningful.
Clear and informative column names are vital when working in, e.g., cognitive psychology or hearing science. They enhance data interpretation, facilitate collaborative research, and ensure that others can easily understand and utilize your datasets.
- How to Rename Column (or Columns) in R with dplyr
- How to Rename Factor Levels in R using levels() and dplyr
More Practical Examples of Adding Columns to a Matrix in R
In this section, we will get into practical examples that demonstrate the significance of adding columns and names to matrices in real-world scenarios, especially in the context of cognitive psychology and hearing science.
Example 1: Cognitive Psychology Research
Imagine we are experimenting to measure reaction times in cognitive psychology. Your data matrix should include columns for subject identification, reaction times, and experimental conditions.
# Create a matrix for reaction time data
reaction_times <- matrix(1:15, nrow = 5)

# Assign column names
colnames(reaction_times) <- c("Subject_ID", "Reaction_Time", "Stimulus_Condition")

# View the matrix with descriptive column names
reaction_timesCode language: PHP (php)
In this example, we have created a matrix with meaningful column names, making understanding the data’s structure easier.
Example 2: Hearing Science Measurements
We might collect data on sound frequencies, amplitudes, and sound types for a hearing science study. Descriptive column names are vital in this context for clear data interpretation.
# Create a matrix for hearing science data
hearing_data <- matrix(c(440, 520, 630, 75, 84, 91, "pure_tone", "white_noise", "pure_tone", "pure_tone"), nrow = 5)

# Assign column names
colnames(hearing_data) <- c("Frequency", "Amplitude", "Duration", "Sound_Type")

# View the matrix with informative column names
hearing_dataCode language: PHP (php)
In the code snippet above, we created a matrix named hearing_data to represent data relevant to hearing science. This matrix contains various variables, including frequency, amplitude, duration, and sound type.
To make this matrix more informative and readable, we assigned relevant column names using the colnames() function. This step is crucial when working with real-world data in hearing science or any other field, as it allows us to easily identify and understand the meaning of each column in our data matrix.
These practical examples illustrate that adding columns and names to matrices is essential in both cognitive psychology and hearing science. It improves data organization, interpretation, and the overall quality of your research.
Advanced Techniques
This section will look into advanced techniques for working with matrices in R. These methods go beyond the basics, offering powerful tools to effectively manipulate and analyze your data.
Reshaping Matrices
Matrices often require reshaping to fit different analytical methods or to meet specific research needs. Reshaping allows you to restructure your data while preserving its integrity.
The following code snippet demonstrates reshaping a matrix using the reshape2 package is especially handy in scenarios where you need to transform data for more advanced statistical analyses.
# Load the reshape2 package
library(reshape2)

# Create a sample matrix
original_matrix <- matrix(1:12, nrow = 4)

# Reshape the matrix
reshaped_matrix <- melt(original_matrix)

# View the reshaped matrix
reshaped_matrixCode language: PHP (php)
Transposing Matrices
Transposing a matrix swaps its rows and columns, which can be beneficial when comparing or combining data from different sources. The following code snippet demonstrates matrix transposition using the base R function t().
# Create a sample matrix
original_matrix <- matrix(1:9, nrow = 3)

# Transpose the matrix
transposed_matrix <- t(original_matrix)

# View the transposed matrix
transposed_matrixCode language: PHP (php)
In the code snippet above, we created a sample matrix named original_matrix with 3 rows and 3 columns dimensions. Next, we used the t() function to transpose the matrix, swapping rows and columns. The resulting transposed matrix, transposed_matrix, is a fundamental operation in data manipulation and is often helpful in various analytical scenarios.
These advanced techniques, including reshaping and transposing matrices, provide additional flexibility and capabilities for data analysis tasks.
Conclusion: How to Add a Column to a Matrix in R
In conclusion, this post has provided a comprehensive guide on how to add columns to matrices in R, emphasizing the importance of this process in data analysis. We explored creating matrices, adding columns, and assigning names to these columns. Throughout this journey, we learned about essential functions and techniques, ensuring that you are well-equipped to manipulate matrices effectively in R.
Remember that understanding how to add columns and names to matrices is fundamental in handling and analyzing data. It allows you to structure and enhance your data, making it more accessible and meaningful for analysis and interpretation.
I hope this post was informative and valuable for your data analysis projects. Please consider sharing it on social media to help others if you liked the post. Moreover, feel free to comment below if you have any questions, suggestions, or requests for future topics. Your feedback is greatly appreciated!
Resources
Here are some more good R resources:
- Not in R: Elevating Data Filtering & Selection Skills with dplyr
- How to use %in% in R: 8 Example Uses of the Operator
- Coefficient of Variation in R
- Correlation in R: Coefficients, Visualizations, & Matrix Analysis
- ggplot Center Title: A Guide to Perfectly Aligned Titles in Your Plots