This brief data analysis tutorial will teach us how to carry out repeated measures ANOVA in Python using the Statsmodels package. More specifically, we will learn how to use the AnovaRM class from statsmodels anova module. Here is a quick overview how to do ANOVA with Python:
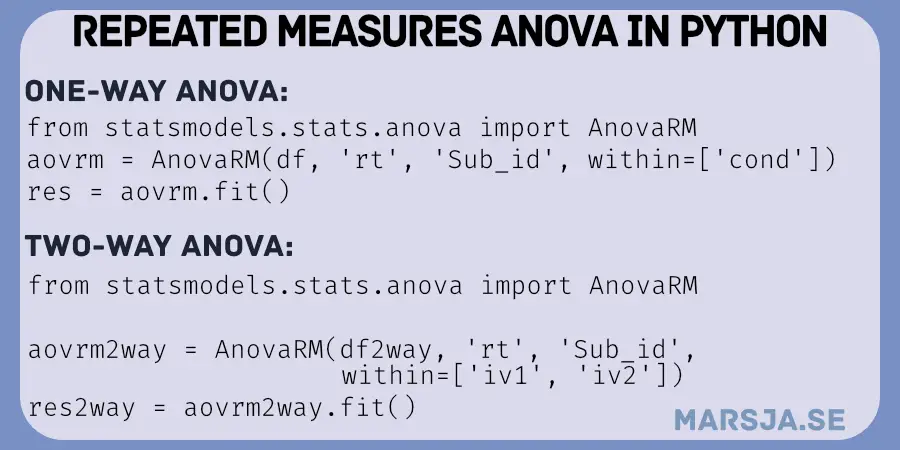
Table of Contents
- Outline
- Prerequisites
- How to Use AnovaRM to Carry Out a Repeated Measures ANOVA
- Repeated Measures ANOVA: R vs. Python (YouTube Video)
- Conclusion
- Resources
Outline
The outline of the post is as follows. We will explore the methodology of conducting a Repeated Measures Analysis of Variance (ANOVA) using the AnovaRM function in Python. The guide will cover both one-way and two-way ANOVA for repeated measures, showcasing the versatility of Statsmodels in handling such analyses.
In the first section, we will implement one-way ANOVA for repeated measures using Statsmodels. Next, we will explore the application of two-way ANOVA for repeated measures in Python. By analyzing a dataset with multiple factors and repeated measures, we will showcase the power of Statsmodels in handling complex experimental designs.
There is also a YouTube video comparing the process of conducting Repeated Measures ANOVA in both Python and R. This comparative analysis will shed light on the differences and similarities between the two popular programming languages. This post aims to equip you with the knowledge and skills to perform repeated measures ANOVA in Python confidently and precisely.
Prerequisites
Before getting into Repeated Measures ANOVA using Statsmodels in Python, there are a few requirements to ensure a smooth learning experience. First and foremost, make sure that you have both Statsmodels and Pandas installed in your Python environment. One easy way to install these Python packages is to use a Python distribution such as Anaconda (see this YouTube Video on how to install Anaconda). However, if you already have Python installed, you can, of course, use Pip.
Before proceeding, ensure that you have installed the latest version of pip. Upgrading pip can be done by running the following command in your terminal or command prompt:
pip install --upgrade pip
Code language: Python (python)
How to Install Statsmodels & Pandas
Statsmodels and Panda can easily be installed using pip:
pip install pandas statsmodelsCode language: Bash (bash)Now, if a newer version of pip is available, and you want to get that version, here’s a blog post about how to upgrade pip.
If a particular version of a package is required, you can easily install it using pip, like this:
pip install statsmodels==0.12.2
pip install pandas==1.3.0Code language: Python (python)
Now you are ready to learn how to carry out ANOVA in Python!
How to Use AnovaRM to Carry Out a Repeated Measures ANOVA
In this section, we will learn how to perform repeated measures of ANOVA using Statsmodels. More specifically, we will learn how to carry out one-way ANOVA and two-way ANOVA in Python. The AnovaRM class takes five arguments:
data: The first argument should be a dataframe object.depvar: The second variable should be your dependent variable. Should be a string (e.g., ‘responsetime’)subject: Here, you put your subject identifier. Should also be a string (e.g., ‘subject’)within: The within-subject factors in a list of strings.aggregate_func: This is optional and should be used if the data contains more than a single observation per participant. It can be “mean” or a function. For instance, you can use Numpy mean (i.e.,np.mean).
Note, if you only have two pairs of matched values (i.e., only to levels of a factor), you can instead use Python to carry out the paired sample t-test.
One-way ANOVA for Repeated Measures Using Statsmodels
First, we start with the one-way ANOVA. The examples below will use Pandas and the AnovaRM class from statsmodels. In the first example, we use Pandas to use read_csv to load this data into a dataframe. See my Python Pandas Dataframe tutorial to learn more about Pandas dataframes.
import pandas as pd
from statsmodels.stats.anova import AnovaRM

df = pd.read_csv('rmAOV1way.csv')Code language: Python (python)
We can use Pandas head() to look at the first five rows (i.e., df.head()):
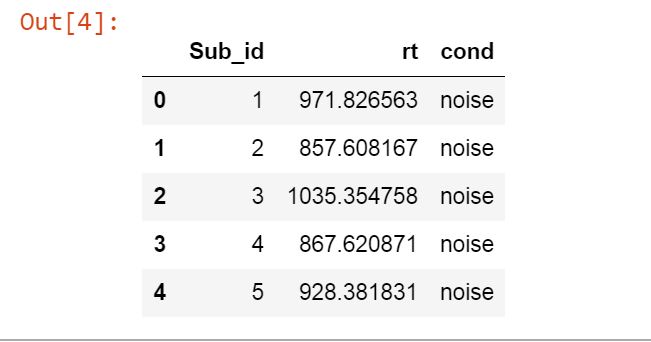
As seen above, we have the columns Sub_id, rt, and cond. These columns represent the subject identifier, dependent, and independent variable. Note there are two levels of cond (using df.cond.unique() will show us noise and quiet).
Python One-way Repeated Measures ANOVA Example:
In the Statsmodels ANOVA example below, we use our dataframe object, df, as the first argument, followed by our independent variable (‘rt’), subject identifier (‘Sub_id’), and the list of the dependent variable, ‘cond’. In the second row, we are getting the fit to print the ANOVA table.
aovrm = AnovaRM(df, 'rt', 'Sub_id', within=['cond'])
res = aovrm.fit()

print(res)Code language: Python (python)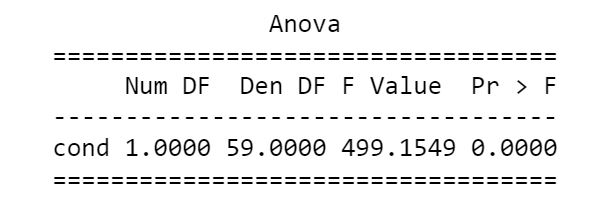
In the second example, we will also use the parameter aggregate_func. Click here to download the dataset.
flanks = pd.read_csv('flanks.csv')
res = AnovaRM(flanks, 'RT', 'SubID', within=['TrialType'], aggregate_func='mean')

print(res.fit())Code language: Python (python)
If your data is not normally distributed, you should consider transforming it to a normal shape.
How to carry out repeated measures ANOVA using other Python packages:
- Repeated Measures ANOVA using Python
- Two-way ANOVA for repeated measures using Python
- Repeated Measures ANOVA in R and Python using afex & pingouin
Two-way ANOVA for Repeated Measures Using Statsmodels
Finally, we continue with the two-way ANOVA. The example below uses Pandas and the AnovaRM class from statsmodels. The example data can be downloaded here.
Two-Way ANOVA Using Statsmodels Example:
Notice the difference between the one-way ANOVA and the two-way ANOVA; the list now contains two variables.
df2way = pd.read_csv('rmAOV2way.csv')
aovrm2way = AnovaRM(df2way, 'rt', 'Sub_id', within=['iv1', 'iv2'])
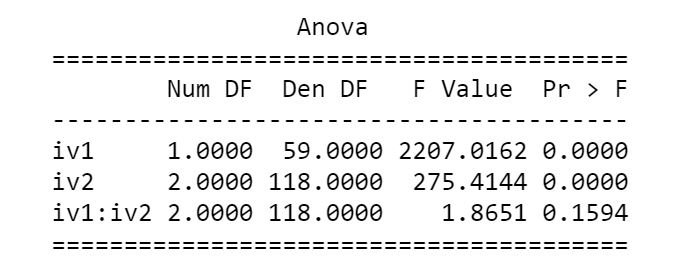
res2way = aovrm2way.fit()
print(res2way)Code language: Python (python)The ANOVA table, when carrying out a two-way ANOVA using statsmodels look like this:
Note, if you only have two groups and your data is independent, you can carry out a two-sample t-test or a Mann-Whitney U test.
Repeated Measures ANOVA: R vs. Python (YouTube Video)
Finally, here’s the YouTube video covering how to carry out repeated measures ANOVA using Python and R. It will further show some differences between the function aov_ez and AnovaRM. Hint: more arguments are available in aov_ez, and it will calculate effect sizes, among other things.
Conclusion
In conclusion, this post has provided a guide to conducting Repeated Measures ANOVA in Python using the powerful Statsmodels library. We implemented one-way and two-way ANOVA for repeated measures.
The comparison of Repeated Measures ANOVA in Python and R through the provided YouTube video further enriches the post, showing each programming languages.
If you found this post helpful, please share it on social media. By spreading the knowledge, you contribute to the growth of the data science community. Finally, I welcome your feedback, suggestions, and comments below, as they help us improve our content and cater to my readers’ specific needs.
Resources
Here are some Python tutorials:
- How to use Python to Perform a Paired Sample T-test
- Create a Correlation Matrix in Python with NumPy and Pandas
- How to use Square Root, log, & Box-Cox Transformation in Python
- Python Scientific Notation & How to Suppress it in Pandas & NumPy
- How to Convert JSON to Excel in Python with Pandas
- Pandas Count Occurrences in Column – i.e. Unique Values

Hey, thanks for the awesome tutorials! They have been super helpful. Just wanted to let you know that your link for the github data under the header”Two-way ANOVA for Repeated Measures Using Statsmodels” is the same as the link for the one-way. I was able to find the data for that data set by simply changing the “rmAOV1way” to “rmAOV2way” in the URL, but others might not realize the data isn’t right for the 2 way model.
Hey Andrew! Glad you found them helpful! Thank you for your comment about the example data. I’ve updated the post to point at the right CSV file. Again, thanks!