One-way ANOVA in Python can be performed using several libraries, each with its own strengths. In this tutorial, I will show four approaches: SciPy, Statsmodels, pyvttbl, and a manual calculation to illustrate how the test works behind the scenes.
Before looking at the code, I will briefly introduce the basic theory behind one-way ANOVA. If you are only interested in the implementation, feel free to skip directly to the examples below.
Update: The pyvttbl package is no longer maintained. At the end of this tutorial, I have also included an example using Pingouin, which is the package I recommend for new projects.
Table of Contents
- Outline
- Prerequisites
- Introduction to ANOVA
- Assumptions of ANOVA
- 6 Steps to Perform a One-Way ANOVA in Python
- One-Way ANOVA in Python: Examples
- Conclusion: Python ANOVA
- Resources
Outline
This tutorial combines the theory behind one-way ANOVA with practical Python examples. After a brief introduction to the assumptions of ANOVA, we will perform the analysis using SciPy, Statsmodels, pyvttbl, and Pingouin. We will also calculate the ANOVA table step by step, discuss pairwise comparisons, and conclude with Tukey’s HSD test.
Prerequisites
In this post, you will need to install the following Python packages:
- SciPy
- NumPy
- Pandas
- Statsmodels
- Pingouin
Of course, you do not have to install all of these packages to perform the ANOVA with Python. Now, if you only want to do the data analysis, you can install SciPy, Statsmodels, or Pingouin. However, Pandas will be used to read the example datasets and carry out some simple descriptive stats and data visualization. Python packages can be installed with pip or conda. Here is how to install all of the above packages:
pip install scipy numpy pandas statsmodels pingouinCode language: Bash (bash)Now, pip can also be used to install a specific version of a package. To install an older version you add “==” followed by the version you want to be installed. In the next section, you will get a brief introduction to ANOVA, in general. Of course, if you only plan to use one of the packages, you can install one. Note, however, if you install statsmodels with e.g. pip you will install also SciPy, NumPY, and Pandas.
Introduction to ANOVA
Before performing a one-way ANOVA in Python, it is useful to understand what the test does. Analysis of variance (ANOVA) tests whether the variability between group means is larger than would be expected from the variability within the groups. In a one-way ANOVA, the total variation in the data is partitioned into variation explained by the groups and unexplained (error) variation. The F statistic is then calculated as the ratio between these two sources of variation.
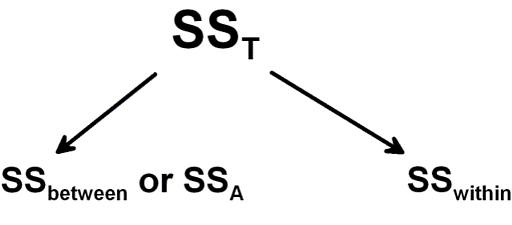
The ratio between these two sources of variation is called the F statistic (or F ratio). Large F values indicate that the differences between the group means are large relative to the variation within the groups.
A one-way ANOVA can also be viewed as a linear regression model with a single categorical predictor. The predictor represents the independent variable and has two or more levels, with each level corresponding to one of the experimental groups.
The general form of the model is:
An alternative parameterization expresses the group means as deviations from the grand mean. Since this tutorial focuses on performing one-way ANOVA in Python rather than the underlying linear model, we will not discuss this formulation further.
One-way ANOVA assumes that the dependent variable is approximately normally distributed within each group, that the groups have similar variances (homogeneity of variance), and that the observations are independent. In addition, the dependent variable should be measured on at least an interval scale.
Assumptions of ANOVA
Assumptions of ANOVA
Like other parametric tests, one-way ANOVA relies on several assumptions. The observations should be independent, the residuals should be approximately normally distributed within each group, and the groups should have similar variances (homogeneity of variance).
Homogeneity of variance can be assessed with Bartlett’s test or Levene’s test (see Levene’s and Bartlett’s Test in Python), while normality can be evaluated using the Shapiro-Wilk test or by inspecting the distribution of the residuals. If the data are noticeably skewed, a transformation such as the logarithmic transformation may be appropriate (see how to do a Log Transformation in Python).
A Priori Comparisons
When performing a one-way ANOVA, it is often preferable to test a small number of planned hypotheses rather than comparing every possible group combination. These planned, or a priori, comparisons are specified before the data are collected and should be motivated by the research question or underlying theory..
Post Hoc Tests (Pairwise Comparisons)
In some studies, the most interesting group differences are not specified until after the data have been collected. These comparisons are referred to as post hoc tests. Because multiple comparisons increase the probability of a Type I error, the significance level should be adjusted to account for the number of comparisons.
Several post hoc procedures are available. In this tutorial, we will use Tukey’s Honestly Significant Difference (HSD) test to perform pairwise comparisons of group means.
6 Steps to Perform a One-Way ANOVA in Python
If you only need a quick overview, the basic workflow is:
- Install
statsmodels(pip install statsmodels). - Import
statsmodelsand theolsfunction. - Load your data into a Pandas DataFrame.
- Fit the linear model:
mod = ols('weight ~ group', data=data).fit() - Run the ANOVA:
aov_table = sm.stats.anova_lm(mod, typ=2) - Print the ANOVA table:
print(aov_table)
Now, sometimes when we install packages with Pip we may notice that we don’t have the latest version installed. If we want to, we can of course, update pip to the latest version using pip or conda.
One-Way ANOVA in Python: Examples
The examples below use the PlantGrowth dataset, which was originally included with R. You can download the dataset here.
The first three examples load the data into a Pandas DataFrame from a CSV file using read_csv() (see How to Read a CSV File with Pandas). If your data are stored in an Excel workbook instead, Pandas also provides the read_excel() function (see How to Read an Excel File with Pandas).
import pandas as pd

datafile = "PlantGrowth.csv"
data = pd.read_csv(datafile)

#Create a boxplot
data.boxplot('weight', by='group', figsize=(12, 8))

ctrl = data['weight'][data.group == 'ctrl']

grps = pd.unique(data.group.values)
d_data = {grp:data['weight'][data.group == grp] for grp in grps}

k = len(pd.unique(data.group))  # number of conditions
N = len(data.values)  # conditions times participants
n = data.groupby('group').size()[0] #Participants in each conditionCode language: Python (python)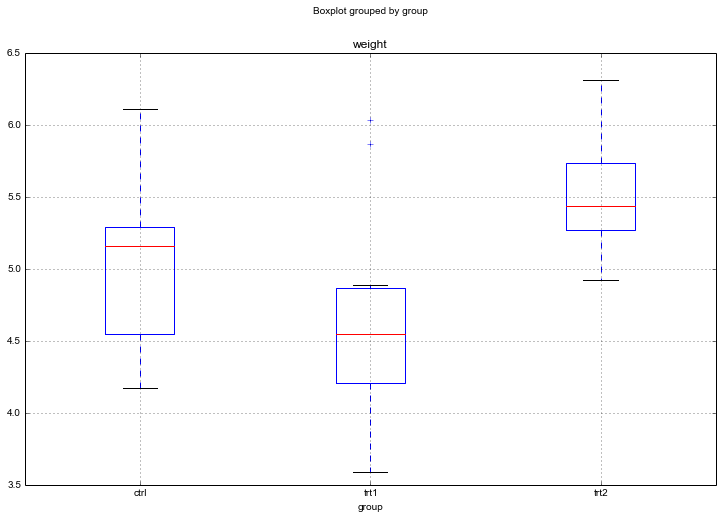
Judging by the Boxplot, there are differences in the dried weight for the two treatments. However, easy to visually determine whether the treatments differ from the control group.
Python ANOVA YouTube Video:
- If you want to learn how to work with Pandas dataframe see the post A Basic Pandas Dataframe Tutorial
- Also, see the Python Pandas Groupby Tutorial for more about working with the groupby method.
- How to Perform a Two-Sample T-test with Python: 3 Different Methods or carry out the Mann-Whitney U test in Python.
One-way ANOVA in Python using SciPy
We start this Python ANOVA tutorial using SciPy and its method f_oneway from stats.
from scipy import stats

F, p = stats.f_oneway(d_data['ctrl'], d_data['trt1'], d_data['trt2'])Code language: Python (python)
This approach quickly calculates the F statistic and its associated p value. However, if you are reporting the results according to APA guidelines, you will also need the degrees of freedom and an effect size, such as eta squared.
The degrees of freedom are straightforward to calculate:
DFbetween = k - 1
DFwithin = N - k
DFtotal = N - 1Code language: Python (python)
Calculating eta squared requires a few additional steps. In the next section, we will use a Pandas DataFrame to calculate the complete ANOVA table, including the effect size.
Calculating a One-Way ANOVA in Pure Python
Although libraries such as SciPy and Statsmodels can perform a one-way ANOVA in just a few lines of code, it is useful to understand how the calculations are performed. In the following sections, we will calculate the ANOVA table step by step, beginning with the sums of squares.
Sum of Squares Between (SSBetween)
The Sum of Squares Between (SSBetween) measures the variability explained by differences between the group means. It is sometimes referred to as the model sum of squares, since it represents the variation explained by the grouping variable. Here is the formula for the SSbetween:
SSbetween = (sum(data.groupby('group').sum()['weight']**2)/n) \
    - (data['weight'].sum()**2)/NCode language: Python (python)
How to Calculate the Sum of Squares Within
The variability in the data due to differences within people. The calculation of Sum of Squares Within can be carried out according to this formula:
sum_y_squared = sum([value**2 for value in data['weight'].values])
SSwithin = sum_y_squared - sum(data.groupby('group').sum()['weight']**2)/nCode language: Python (python)
Calculation of Sum of Squares Total
The sum of Squares Total will be needed to calculate eta-squared later. This is the total variability in the data.
SStotal = sum_y_squared - (data['weight'].sum()**2)/NCode language: Python (python)How to Calculate Mean Square Between
The mean square between is the sum of squares between divided by the degrees of freedom between.
MSbetween = SSbetween/DFbetweenCalculation of Mean Square Within
The mean Square within is also an easy calculation;
MSwithin = SSwithin/DFwithinCode language: Python (python)Calculating the F-value
Here is how we calculate the F-value in Python:
F = MSbetween/MSwithinCode language: Python (python)To reject the null hypothesis, we check whether the obtained F-value exceeds the critical value for rejecting it. We could look it up in an F-value table using the DFwithin and DFbetween values. However, SciPy provides a method for obtaining a p-value.
p = stats.f.sf(F, DFbetween, DFwithin)Code language: Python (python)Finally, we will also calculate the effect size. We start with the commonly used eta-squared (η² ):
eta_sqrd = SSbetween/SStotalCode language: Python (python)However, eta-squared is somewhat biased because it is based purely on sums of squares from the sample. No adjustment is made for the fact that we are aiming to estimate the effect size in the population. Thus, we can use the less biased effect size measure Omega squared:
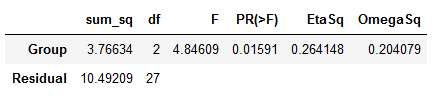
om_sqrd = (SSbetween - (DFbetween * MSwithin))/(SStotal + MSwithin)Code language: Python (python)The results from both the SciPy and the above method can be reported according to APA style; F(2, 27) = 4.846, p = .016, η² = .264. If you want to report Omega Squared: ω2 = .204. That was it; now we know how to do ANOVA in Python by calculating everything “by hand”.
ANOVA in Python using Statsmodels
In this section of the Python ANOVA tutorial, we will use Statsmodels. First, we use the ordinary least squares (ols) method and then the anova_lm method. Also, if you are familiar with R syntax, Statsmodels has a formula API where our model is very intuitively formulated.
Here are three simple steps for carrying out ANOVA using Statsmodels:
Time needed: 1 minute
The ANOVA how-to below assumes that the data is in a Pandas dataframe (i.e., df).
- Import the needed Python packages
First, we import statsmodels API and ols:

- Set up the ANOVA model
Second, we use ols to set up our model using a formula

- Carry out the ANOVA
We can now use anova_lm to carry out the ANOVA in Python

In the ANOVA example below, we import the API and the formula API. Second, we use ordinary least squares regression with our data. The object obtained is a fitted model we later use with the anova_lm method to obtain an ANOVA table.
In the final part of this section, we will carry out pairwise comparisons using Statsmodels.
import statsmodels.api as sm
from statsmodels.formula.api import ols

mod = ols('weight ~ group',
                data=data).fit()

aov_table = sm.stats.anova_lm(mod, typ=2)
print(aov_table)Code language: Python (python)
ANOVA Python table:

Note: no effect sizes are calculated when we use Statsmodels. To calculate eta squared, we can use the sum of squares from the table:
esq_sm = aov_table['sum_sq'][0]/(aov_table['sum_sq'][0]+aov_table['sum_sq'][1])aov_table['EtaSq'] = [esq_sm, 'NaN']print(aov_table)Code language: Python (python)
Python ANOVA: Pairwise Comparisons
It is, of course, also possible to calculate pairwise comparisons for our Python ANOVA using Statsmodels. In the next example, we are going to use the t_test_pairwise method. Conducting post-hoc tests, corrections for familywise error can be carried out using several methods (e.g., Bonferroni, Šidák)
pair_t = mod.t_test_pairwise('group')
pair_t.result_frameCode language: Python (python)
Note: if we want to use another correction method, we add the parameter method and add “bonferroni” or “sidak” (e.g., method="sidak").
If we were to conduct regression analysis using Python, we might have to convert the categorical variables to dummy variables using Pandas get_dummies() method.
Python ANOVA using pyvttbl anova1way
In this section, we will learn how to perform an ANOVA in Python using the anova1way method from the pyvttbl package. This package also has a DataFrame method. We have to use this method instead of a Pandas DataFrame to perform one-way ANOVA in Python. Note: Pyvttbl is old and outdated. It requires Numpy to be at most version 1.1.x or else you will run into an error ( “unsupported operand type(s) for +: ‘float’ and ‘NoneType’”).
This can, of course, be solved by downgrading NumPy (see my solution using a virtual environment Step-by-step guide for solving the Pyvttbl Float and NoneType error). However, it may be better to use pingouin for carrying out Python ANOVAs (see the next section of this blog post).
from pyvttbl import DataFrame

df=DataFrame()
df.read_tbl(datafile)
aov_pyvttbl = df.anova1way('weight', 'group')
print aov_pyvttblCode language: Python (python)
Output anova1way
Anova: Single Factor on weight

SUMMARY
Groups   Count    Sum     Average   Variance
============================================
ctrl        10   50.320     5.032      0.340
trt1        10   46.610     4.661      0.630
trt2        10   55.260     5.526      0.196

O'BRIEN TEST FOR HOMOGENEITY OF VARIANCE
Source of Variation    SS     df    MS       F     P-value   eta^2   Obs. power
===============================================================================
Treatments            0.977    2   0.489   1.593     0.222   0.106        0.306
Error                 8.281   27   0.307
===============================================================================
Total                 9.259   29

ANOVA
Source of Variation     SS     df    MS       F     P-value   eta^2   Obs. power
================================================================================
Treatments             3.766    2   1.883   4.846     0.016   0.264        0.661
Error                 10.492   27   0.389
================================================================================
Total                 14.258   29

POSTHOC MULTIPLE COMPARISONS

Tukey HSD: Table of q-statistics
       ctrl     trt1       trt2
=================================
ctrl   0      1.882 ns   2.506 ns
trt1          0          4.388 *
trt2                     0
=================================
  + p < .10 (q-critical[3, 27] = 3.0301664694)
  * p < .05 (q-critical[3, 27] = 3.50576984879)
 ** p < .01 (q-critical[3, 27] = 4.49413305084)Code language: HTTP (http)
We get a lot of more information using the anova1way method. What may be of particular interest here is that we get results from a post-hoc test (i.e., Tukey HSD). Whereas the ANOVA only tells us that there was a significant effect of treatment, the post-hoc analysis reveals where this effect lies (between which groups).
If you have more than one dependent variable, a multivariate method may be more suitable. Learn more on how to carry out a Multivariate Analysis of Variance (ANOVA) using Python:
Python ANOVA using Pingouin (bonus)
In this section, we will learn how to perform ANOVA in Python using the pingouin package. This package, as with Statsmodels, is very simple to use. If we want to carry out an ANOVA, we use anova.
import pandas as pd
import pingouin as pg

data = "https://vincentarelbundock.github.io/Rdatasets/csv/datasets/PlantGrowth.csv"

df = pd.read_csv(data, index_col=0)

aov = pg.anova(data=df, dv='weight', between='group', detailed=True)
print(aov)Code language: Python (python)
As shown in the ANOVA table above, we obtain the degrees of freedom, the mean square error, the F- and p-values, and the partial eta squared using pingouin.
Pairwise Comparisons in Python (Tukey-HSD)
One neat thing with Pingouin is that we can also carry post-hoc tests. We will now conduct the Tukey-HSD test as a follow-up to our ANOVA. This is also very simple; we use the pairwise_tukey method to carry out the pairwise comparisons:
pt = pg.pairwise_tukey(dv='weight', between='group', data=df)
print(pt)Code language: Python (python)
Note: if we want another type of effect size, we can add the argument effsize and choose among six different effect sizes (or none): Cohen’s d, Hedges’ g, Glass’s delta, eta-squared, odds ratio, and AUC. In the last code example, we change the default effect size (Hedges’) to Cohen:
cpt = pg.pairwise_tukey(dv='weight', between='group', effsize='cohen', data=df)
print(pt)Code language: Python (python)Conclusion: Python ANOVA
That is it! In this tutorial, you learned four methods for performing one-way ANOVAs in Python. There are other ways to deal with the tests between groups (e.g., post hoc analysis).
One could carry out Multiple Comparisons (e.g., t-tests between each group). Remember to correct for family-wise error! Or Planned Contrasts. In conclusion, doing ANOVAs in Python is pretty simple.
Resources
Here are some more Python tutorials:
- Python Scientific Notation & How to Suppress it in Pandas & NumPy
- How to Plot a Histogram with Pandas in 3 Simple Steps
- Find the Highest Value in Dictionary in Python

Heck of a job there, it aboesutlly helps me out.
Thank you for your effort, very clearly set.
However, I am hitting a problem using ANOVA1Way, I wonder if you have any suggestions. When I make a copy of PlantGrowth.csv and type in new numbers for “weight” and then run your code, I get:
Error: new-line character seen in unquoted field – do you need to open the file in universal-newline mode?
Thanks and Regards
Hey Umit,
I cannot really answer your question since the error does not happen on my computer. I did find this: http://stackoverflow.com/questions/17315635/csv-new-line-character-seen-in-unquoted-field-error. Maybe you could test that and see if it works. If you solve your problem, or have already solved it, please let me know how.
Thanks and regards,
Erik
Hi Erik,
thanks for the great post. I wanted to offer an update to part 2 (python based ANOVA) for when the groups have different sample sizes.
First, rewrite the calculation for n:
n = data.groupby(var).size().values
Then the calculation for SSbetween and SSwithin needs to be modified:
SSbetween = (sum(data.groupby(var).sum()[‘LogSalePrice’].values**2/n)) – (data[‘LogSalePrice’].sum()**2)/N
SSwithin = sum_y_squared – sum(data.groupby(var).sum()[‘LogSalePrice’].values**2/n)
It just takes the division by n (element-wise) inside the outer sum in both cases.
I tested this by comparing with the output from f_oneway and it seems to work. It should also generalize well to the case where n is the same for all groups.
Thanks again for the write-up!
Hi Joel,
thanks for your comment and thanks for the update! I’ll add this to the post (with a reference to your comment, of course).
Erik
Thanks for your post… It was super useful for me
Hi Erik!
Thank you for the post. I’ve been working recently on a Python stats package that implements several ANOVA-related functions and post-hocs tests. Just thought I’d mention it in case this would turn useful to you or others: https://pingouin-stats.org/
All the best,
Raphael
Hey Raphael,
This looks really interesting! Will install this later today and play around with it. I might just add it to one of my posts listing useful Python packages. We’ll see!
Maybe I’ll also update this post (or write a new one). I’ll send you an email, if I do.
Thanks for letting us know about the package,
Best,
Erik