Are you searching for a way to extract p-values from the lm() function in R? In this blog post, we will explore how to obtain p-values from linear regression models using the lm() function in R.
Linear regression is a statistical technique commonly employed in various fields, including psychological research. It allows us to investigate the relationship between a dependent variable and one or more independent variables. By fitting a regression model, we can estimate the relationship’s strength and direction, assess the effects’ significance, and make predictions based on the observed data.
However, it is not sufficient to merely examine the estimated coefficients of a regression model; we need to assess their statistical significance. P-values play a role in this process. They provide a measure of evidence against the null hypothesis, indicating whether the observed effects are statistically significant or simply due to chance. Extracting p-values allows us to evaluate the reliability of the estimated coefficients and determine their practical relevance.
In the next sections of this blog post, we will dive into the process of extracting p-values from lm() in R, guiding you through the necessary steps and illustrating the practical application of this valuable statistical information. Let’s unlock the power of p-values and enhance how we interpret linear regression results in R!
Table of Contents
- Outline
- Requirements
- Synthetic Data
- Regression Model in R
- How to Extract P-values from lm in R
- Extract the P-values from lm() in R from All Predictors
- Extracting P-values from lm() in R using the tidy() Function
- Conclusion: Extract P-values from lm() in R
- Other Resources
Outline
In this post, we will explore the process of extracting p-values from the lm() function in R. To begin, we will generate synthetic data to create a suitable regression model for our analysis. This synthetic data will include Pure Tone Average (PTA) and Inhibitory Control (IC) predictors. Next, we will demonstrate how to fit a regression model using the lm() function in R, incorporating the generated synthetic data.
Once the regression model is established, we will jump directly to the post’s main focus: extracting p-values. We will introduce the broom package, which provides a convenient and tidy approach to extracting essential information from statistical models. Specifically, we will explore the usage of the tidy() function from broom to extract p-values from the regression model. Moving forward, we will look at extracting p-values from all predictors in the regression model.
Additionally, we will demonstrate how to extract p-values specifically using the tidy() function, highlighting the ease and efficiency of this approach. This method will enable you to obtain the p-values in a tidy format, facilitating further analysis or integration into reports and theses.
By the end of this post, you will have a comprehensive understanding of how to extract p-values from the lm() function in R.
Requirements
To generate the synthetic data used in this blog post, you may optionally utilize the dplyr package. Although not mandatory, dplyr provides a convenient and efficient way to manipulate and transform data in R. With its intuitive syntax and powerful functions, dplyr simplifies common data manipulation tasks such as filtering, selecting columns, creating new variables, and summarizing data.
For those interested in extracting p-values from the lm() function using the broom package, it needs to be installed. The broom package simplifies obtaining information from statistical models, including regression models, in a tidy format. It offers functions like tidy(), glance(), and augment() that allows you to extract coefficients, p-values, model fit measures, and more. Installing broom enables you to access and analyze model outputs easily.
Using dplyr alongside broom can further streamline your data analysis workflow. Combining these packages enables you to seamlessly generate synthetic data, apply regression models, and extract essential information like p-values tidy and efficiently.
With its broad range of capabilities, dplyr serves as a valuable tool for data manipulation and transformation, facilitating tasks such as reshaping data from wide to long format, filtering observations based on specific conditions, or removing unnecessary columns. Incorporating dplyr into your R programming toolkit empowers you to efficiently manipulate, clean, and prepare your data for analysis, saving you time and effort throughout the data processing stage. Finally, you may also want to update R to the latest version.
Synthetic Data
Here are a synthetic data set we can use to practice extracting p-values from lm() in R:
# Load necessary libraries
library(dplyr)

# Set seed for reproducibility

set.seed(123)

# Generate synthetic data

n <- 100 # Number of observations

# Create PTA variable

PTA <- rnorm(n, mean = 30, sd = 5) # Pure tone average (mean = 30, sd = 5)

# Create SNR variable

SNR <- -7.1 * PTA + rnorm(n, mean = 0, sd = 3) # Signal-to-noise ratio (SNR)

# Create IC variable

IC <- rep(504, n) + rnorm(n, mean = 0, sd = 50) # Inhibitory control (IC)

# Standardize the variables using z-scores

PTA <- scale(PTA)
SNR <- scale(SNR)
IC <- scale(IC)

# Combine variables into a data frame

data <- data.frame(PTA, SNR, IC)Code language: R (r)
In the code chunk above, we first load the necessary dplyr library for data manipulation and analysis.
Next, we set the seed to ensure the reproducibility of the generated synthetic data. To generate the data, we specify the number of observations n as 100. We create the PTA A variable, representing the pure tone average, which is randomly sampled from a normal distribution with a mean of 30 and a standard deviation of 5.
The SNR variable, which denotes the signal-to-noise ratio, is generated by multiplying -7.1 by the PTA variable and adding random noise sampled from a normal distribution with a mean of 0 and a standard deviation of 3.
For the IC variable, which stands for inhibitory control, we set a constant value of 504 for all observations using the rep() function. To introduce variability, we add random noise sampled from a normal distribution with a mean of 0 and a standard deviation of 50. Specifically, we used the rep() function to generate a squence of numbers. To ensure comparability across variables, we standardize the data using z-scores. Standardization transforms each variable into a mean of 0 and a standard deviation of 1. Finally, we combine the standardized variables into a dataframe data, ready for further analysis and exploration of the predictors’ significance in multiple regression models.
Regression Model in R
Here is how to perform a multiple regression analysis in R using the standardized variables from the data dataframe:
# Fit the model:
fit <- lm(SNR ~ PTA + IC, data = data)
# View the summary of the regression model
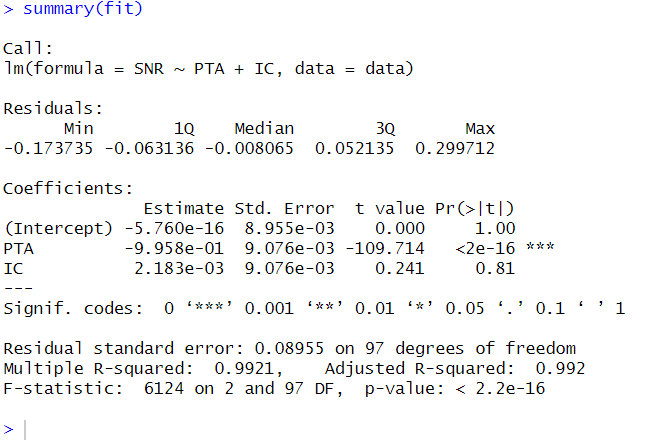
summary(fit)Code language: R (r)In the code chunk above, we fit a multiple regression model using the lm() function in R. The formula SNR ~ PTA + IC specifies that the dependent variable SNR is regressed on the independent variables PTA and IC.
By assigning the result of the regression model to the fit object, we store the fitted model for further analysis and examination. To obtain a summary of the regression results, we use the summary() function on the fit object. This provides detailed information about the coefficients, standard errors, t-values, and p-values associated with each predictor in the model.
Furthermore, it is worth mentioning that in addition to multiple regression, R offers various regression models, such as probit regression, which can be used to model binary outcomes. These different regression techniques allow us to explore and analyze relationships between variables in various contexts and research questions. Also, you can make dummy variables in R if you have categorical predictors.
How to Extract P-values from lm in R
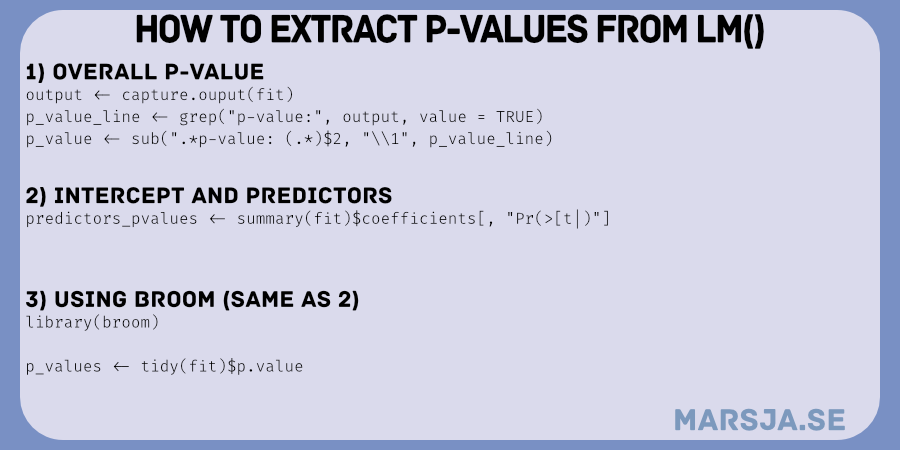
Here is how we can extract the overall p-value from the lm() object in R:
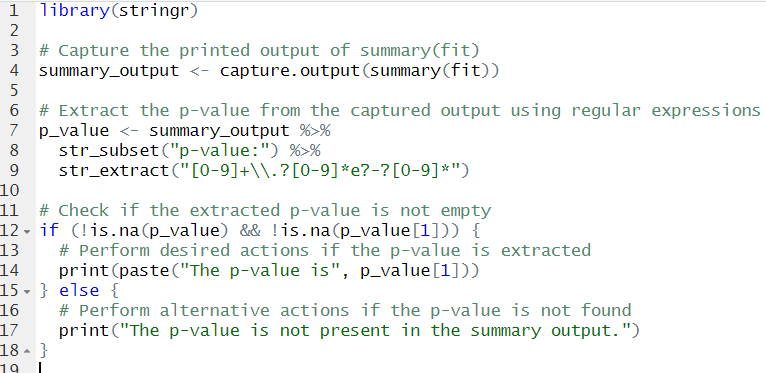
# Capture the printed output of summary(fit)
summary_output <- capture.output(summary(fit))

# Extract the p-value from the captured output
p_value_line <- grep("p-value:", summary_output, value = TRUE)
p_value <- sub(".*p-value: (.*)$", "\\1", p_value_line)

# Check if the extracted p-value is not empty
if (!is.na(p_value) && !is.na(p_value[1])) {
    # Perform desired actions if the p-value is extracted
    print(paste("The p-value is", p_value[1]))
} else {
    # Perform alternative actions if the p-value is not found
    print("The p-value is not present in the summary output.")
}Code language: R (r)
In the code chunk above, we capture the printed output of the summary(fit) function using capture.output(). We extract the p-value from the captured output by searching for the line containing “p-value:” using grep() and specifying value = TRUE. Using the sub() function, we extract the actual p-value from the selected line of text. Next, we check if the extracted p-value is not empty using !is.na(). If the p-value is successfully extracted, we print a message including the extracted p-value. However, if the p-value is not found in the summary output, we print a message indicating it is absent. This code enabled us to automate the extraction of the p-value from the summary output. However, we may be interested in a specific predictor and need to extract its p-value in R. Here is how we can do it using the dplyr and stringr packages:
Extract the P-values from lm() in R from All Predictors
Here is how we can extract the p-value from lm() for all predictor variables, including the intercept:
# Extract the p-values of the predictors from the model
predictor_pvalues <- summary(fit)$coefficients[, "Pr(>|t|)"]

# Print the predictor p-values
print(predictor_pvalues)Code language: R (r)
In the code above, we extract the p-values of the predictors from the fit using the summary() function. The coefficients attribute of the summary object contains information about the coefficients, including the p-values.
By selecting the column "Pr(>|t|)" from the coefficients attribute, we specifically obtain the p-values of the predictors.
Finally, we print the predictor p-values using the print() function to view the results.
Executing this code will provide you with the p-values of the predictors in the regression model. These p-values indicate the statistical significance of each predictor concerning the dependent variable.
Extracting P-values from lm() in R using the tidy() Function
Here is an example of how to use the broom package to extract p-values from the regression model fit:
# Load the broom package
library(broom)

# Extract p-values using broom's tidy() function
p_values <- tidy(fit)$p.value

# Print the predictor p-values
print(p_values)Code language: R (r)
In the code above, we first load the broom package using the library() function. Then, we use the tidy() function from the broom package to extract information from the regression model fit, including the p-values of the predictors. By accessing the p.value column from the result of tidy(fit), we obtain the p-values of the predictors. Finally, we print the predictor p-values using the print() function to display the results.
Running this code will extract the p-values from lm in R. Specifically, we extracted the p-values using the broom package. The output will display the p-values, indicating the statistical significance of each predictor in the regression model.
Using the broom package simplifies the process of extracting model information, such as p-values, and provides a tidy output that can be easily further analyzed or visualized.
Conclusion: Extract P-values from lm() in R
In conclusion, we have learned how to extract the p-values from lm() in R. By using the broom package, we accessed vital information about statistical significance in regression models. This knowledge empowers us to make informed decisions and draw meaningful conclusions from our analyses.
With the ability to extract p-values, we can confidently identify the significance of predictors, understand their impact on the outcome variable, and communicate our findings effectively. This valuable skill applies to various fields, including Psychology, social sciences, and beyond.
I encourage you to implement these techniques in your data analysis projects, whether in research papers, theses, or real-world applications. Share this blog post with your colleagues and fellow data enthusiasts to spread knowledge and enhance the statistical prowess of your community.
Remember, extracting p-values from lm() in R is just one step toward unlocking the full potential of your data. Keep exploring, learning, and utilizing the vast statistical tools to further your data-driven journey.
Other Resources
Here are some other resources that you may find helpful:
- How to Make a Residual Plot in R & Interpret Them using ggplot2
- Mastering SST & SSE in R: A Complete Guide for Analysts
- How to Calculate Z Score in R
- Report Correlation in APA Style using R: Text & Tables

That’s a very painful way to get the overall p value. Simpler:
glance(summary(model))$p.value
Hey David!
Thanks for your comment. I will update the post later today to include your suggestion,
Erik