In this short post, we will learn how to save a Seaborn figure to a range of different file formats. More specifically, we will learn how to use the plt.savefig method save plots made with Seaborn to:
- Portable Network Graphics (PNG)
- Portable Document Format (PDF)
- Encapsulated Postscript (EPS)
- Tagged Image File Format (TIFF)
- Scalable Vector Graphics (SVG)
First, we will create some basic plots and work with Matplotlibs savefig method to export the files to different file formats. There is more information on data visualization in Python using Seaborn and Matplotlib in the following posts:
- 9 Data Visualization Techniques you Need to Know in Python
- How to Make Seaborn Scatter Plots in Python
- Exploratory Data Analysis in Python (Scatter plots)
- How to Visualize Response Time Distributions using Python and Seaborn
Table of Contents
- Prerequisites: Python and Seaborn
- 4 Steps to Save a Seaborn Figure as a File
- Using the plt.savefig Method
- How to Save a Seaborn Plot as a File (i.e., png, eps, svg, pdf)
- Example Data
- How to Save a Seaborn Plot as png
- Saving a Seaborn Plot as a High-Resolution PNG
- How to Save a Seaborn Figure as a Transparent PNG
- Save a Seaborn Figure as a PDF File
- Saving a Seaborn Python Plot as a High-Resolution PDF file
- How to Save Python Data Visualizations (e.g., Seaborn plots) to an EPS file
- Saving a Seaborn Plot as a High-resolution EPS file
- Saving the Seaborn Plot in Landscape (EPS)
- How to Save Seaborn plots to TIFF files
- Saving a Python (Swarm) Plot as a High-Resolution TIFF File
- How to Save a Plot in Python Seaborn as an SVG File
- Save a Seaborn Plot as a File: YouTube Tutorial
- Conclusion: Saving Plots in Python to Files
- Resources
Prerequisites: Python and Seaborn
Before learning how to save Seaborn plots (e.g., to .png files), we need to have both Python and Seaborn installed. There are two easy methods to install Seaborn. First, if we do not have Python installed we can download and install a Python distribution packed with Seaborn (e.g., Anaconda). Second, if we already have Python installed we can install Seaborn using Pip. Of course, there are several mandatory dependencies (i.e., NumPy, SciPy, Matplotlib, & Pandas) but pip will install them too. At times, we may need to update Seaborn and we will after we have installed Seaborn, learn how to update Seaborn to the latest version.
How to Install Seaborn with Pip
Now we’re ready to use pip to install Seaborn. It’s very simple. First, we open up a terminal window, or Windows command prompt, and type pip -m install seaborn. Pip can also be used to install a certain version of a Seaborn if needed. Just add “==” and the version you need to install.
How to Upgrade Seaborn using Pip and Conda
In this section, before creating and saving a Seaborn plot we will learn how to upgrade Seaborn using pip and conda. First, if we want to upgrade Seaborn with pip we type the following code: pip install -upgrade seaborn.
If we, on the other hand, have the Anaconda Python distribution installed we will use conda to update Seaborn. Now, this is also very easy, and we will open up a terminal window (or the Anaconda Prompt if we use Windows) and type conda update seaborn.
Learn more about installing, using, and upgrading Python packages using pip, pipx, and conda in the following two posts:
- Installing, using. and upgrading Python packages using pip and conda
- Installing Python packages directly into virtual environments using pipx
When installing and upgrading packages, we may notice that we also need to upgrade pip. This can be done by typing pip install --upgrade pip. Now that you know what you need to have installed to follow this post, we can continue to the 4 steps to save a Seaborn plot.
4 Steps to Save a Seaborn Figure as a File
Now, before getting into the details in how to export a Seaborn plot as a file, we will summarize the method in 4 simple steps:
1. Import the Needed Libraries:
First, we need the libraries to work with before saving a plot. Thus, we import Seaborn, Matplotlib.pyplot, and Pandas:
import seaborn as sns
import matplotlib.pyplot as plt
import pandas as pdCode language: Python (python)
Notice how we follow the convention and impor the packages according to common used acronyms (e.g. “sns” for Seaborn).
2. Load the Data to Visualize:
Second, we need to load the data we are going to visualize in Python:
data = 'https://vincentarelbundock.github.io/Rdatasets/csv/datasets/mtcars.csv'
df = pd.read_csv(data, index_col=0)Code language: Python (python)
Typically, we might already know how to load data when we save the plot(s). For completeness, however, this step is included as it is one of the steps to save a figure. In the next step, we will create the figure.
3. Create the Plot
Third, we need to create the figure to be saved. Here we’ll use Seaborn’s distplot(FILE_NAME_AND_PATH) method (see examples below, as well):
sns.distplot(df['mpg'])Code language: Python (python)Running the above command will create a distribution plot. The next section will save the plot we created as a .png file.
4. Save the Seaborn Figure
Finally, we can save the plot with plt.savefig(). Continue to learn more about exporting figures (e.g., as .eps, .tiff).
plt.savefig('save_as_a_png.png')Code language: Python (python)That were the four steps to export a Seaborn figure; in the following sections, we will learn more about plt.savefig() and how to save Seaborn plots as different file types (e.g., png, eps). In the next section, you will learn more about the syntax of plt.savefig().
Using the plt.savefig Method
In this section, before we start saving a Seaborn plot as a file, we are going to learn a bit more about the plt.savefig method.
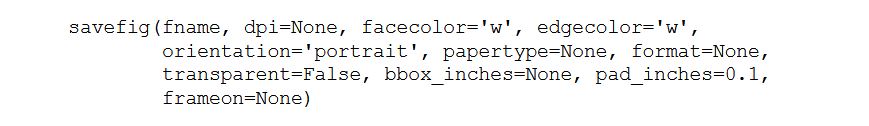
As seen in the image above, we have several arguments.
In this post, we will work with some of them when saving Seaborn plots as a file (e.g., PDF). Specifically, we will use the fname, dpi, format, orientation, and transparent. Now, orientation can only be used in the format is postscript (e.g., eps). Thus, we will only use it when saving a Seaborn plot as a .eps file.
Concerning the other arguments, they will work with other formats as well, but we will only use them when we save a Seaborn plot as a png file.
How to Save a Seaborn Plot as a File (i.e., png, eps, svg, pdf)
In this section, we will finally learn how to save a Seaborn plot. Now, in all the examples of saving Seaborn plots here, we will start by creating a plot. First, we must import Seaborn, matplotlib.pyplot, and Pandas. Here, we follow convention and import seaborn as sns, matplotlib.pyplot as plt, and pandas as pd. Note we need to do this in all our Python scripts to visualize data and save the plots to files.
import seaborn as sns
import matplotlib.pyplot as plt
import pandas as pdCode language: Python (python)
Example Data
Next, we are going to import data to visualize. Here, we use Pandas and the pd.read_csv method to load data from a CSV file.
data = 'https://vincentarelbundock.github.io/Rdatasets/csv/datasets/mtcars.csv'
df = pd.read_csv(data, index_col=0)
df.head(6)Code language: Python (python)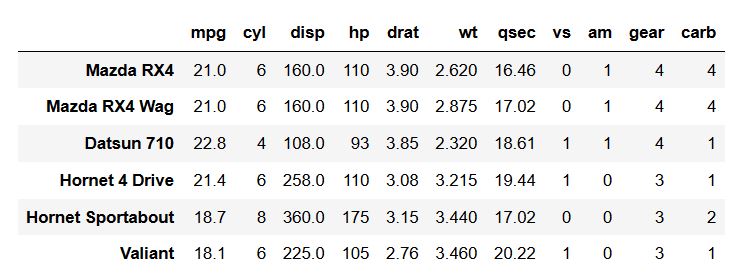
The above output we obtained by using the head() method. This is a great way to get a quick view of the first rows of our dataset. The next section will teach you how to save your Seaborn figure as a .png file.
How to Save a Seaborn Plot as png
In the first example, we will save the Seaborn figure as Portable Network Graphics (png). First, we need to create our plot, and we are going to create a simple histogram using sns.distplot. Here’s how to use plt.savefig to export a plot as a PNG file:
sns.distplot(df['mpg'])

# Saving the Seaborn Figure:
plt.savefig('save_as_a_png.png')Code language: Python (python)
In the second line of code, we used plt.savefig with only the fname argument. Note we are saving the file as a png only by using a string as fname. That is, we add the file ending .png to tell plt.savefig that we want the Seaborn plot saved as a png.
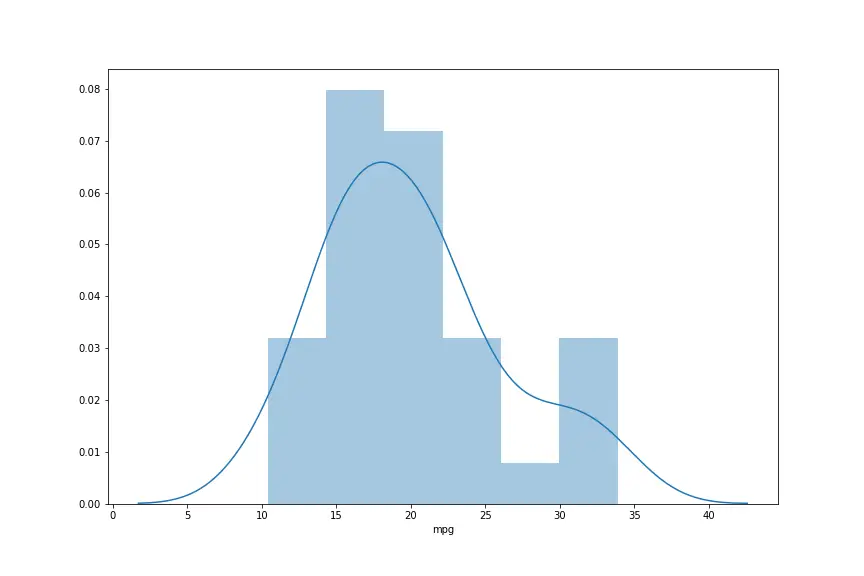
Note the above image was created to be larger than running the code above. The next section will teach you how to save your figure as a high-resolution .png file.
Saving a Seaborn Plot as a High-Resolution PNG
Now, we will also use the dpi argument here. If we, for instance, wanted to save the histogram plot as a high-resolution image file. Most commonly, however, when we need a high-resolution image, we also want a different format. Anyway, if we want to save the histogram with 300 dpi, this is how we do it:
sns.distplot(df['mpg'])
plt.savefig('saving-a-high-resolution-seaborn-plot.png', dpi=300)Code language: Python (python)
That was how to save the plot as a high-resolution .png file. In the next example, we will export the figure as a transparent PNG.
How to Save a Seaborn Figure as a Transparent PNG
In this example, we will save the Seaborn plot as a transparent png. We will use the transparent argument and set it to true.
sns.distplot(df['mpg'])

# Seaborn Save Figure:
plt.savefig('saving-a-seaborn-plot-as-png-file-transparent.png',
           transparent=True)Code language: Python (python)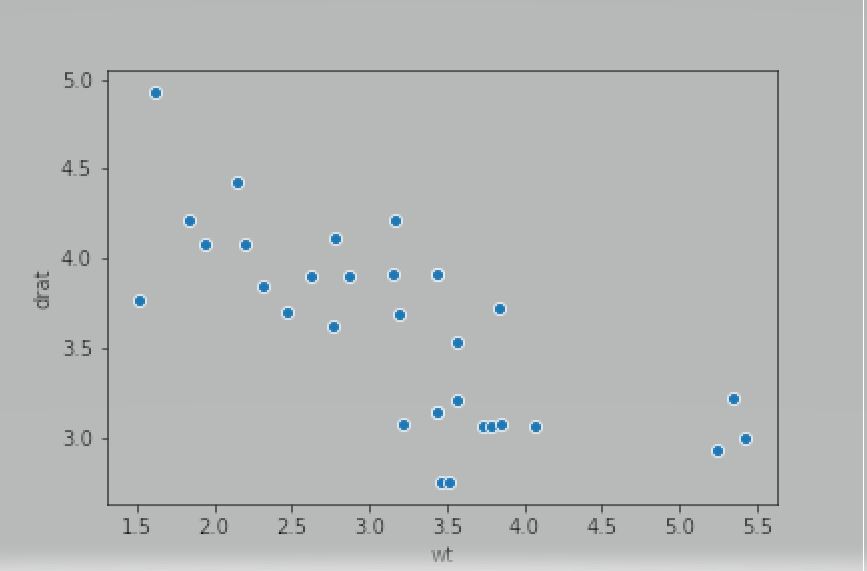
As you may already know, we can save our plots in other file formats. The next section will look at how we can save the figure as a .pdf file.
Save a Seaborn Figure as a PDF File
This section will teach us how to save a Seaborn plot as a .pdf file. When we learned how to save a histogram figure as a png, we first need to make a plot. Here, we will create a scatter plot using the scatterplot method from Seaborn.
sns.scatterplot(x='wt', y='drat', data=df)
plt.savefig('saving-a-seaborn-plot-as-pdf-file.pdf')Code language: Python (python)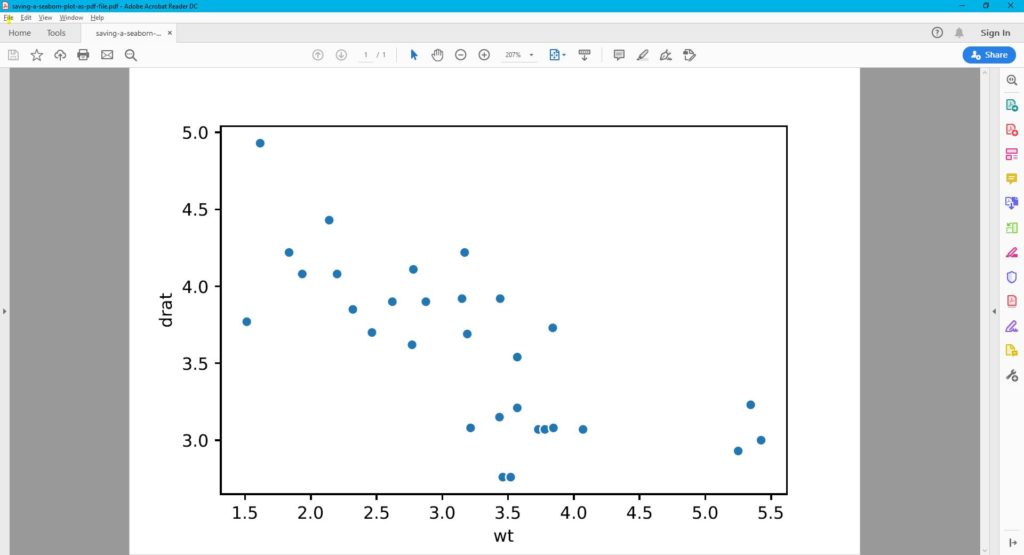
Saving a Seaborn Python Plot as a High-Resolution PDF file
In this section, we are going to use the dpi argument again. Many scientific journals require image files to be in high-resolution images. For example, the PLOS journals (e.g., Plos One) require figures to be in 300 dpi. Here is how to save a Seaborn plot as a PDF with 300 dpi:
sns.scatterplot(x='wt', y='drat', data=df)
plt.savefig('saving-a-seaborn-plot-as-pdf-file-300dpi.pdf',
           dpi=300)Code language: Python (python)
How to Save Python Data Visualizations (e.g., Seaborn plots) to an EPS file
In this section, we will carry on and learn how to save a Seaborn plot as an Encapsulated Postscript file. First, we will change the file ending (the fname argument) to .eps to export the plot as an EPS file. Second, we will learn how to save the Seaborn plot as a high-resolution .eps file.
In this example, we are going to create a violin plot using Seaborn’s catplot method and save it as a file:
sns.catplot(x='cyl', y='drat', hue='am',
                data=df, kind='violin')

# Seaborn Save Plot:
plt.savefig('saving-a-seaborn-plot-as-eps-file.eps')Code language: Python (python)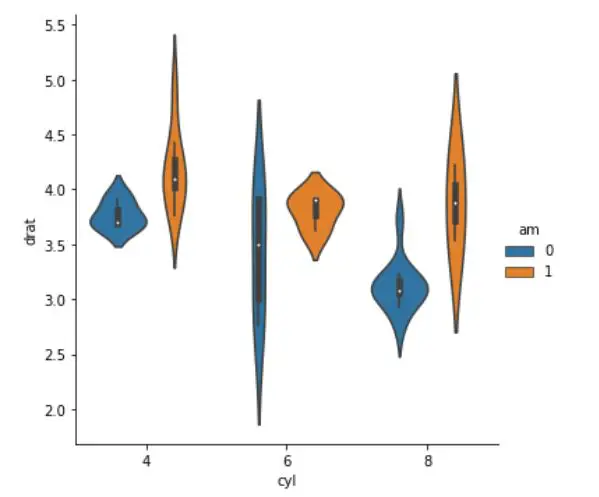
Saving a Seaborn Plot as a High-resolution EPS file
Now, we are already familiar with how to set the dpi, but in the next example, we are going to save the Seaborn violin plot as a high-resolution image file:
sns.catplot(x='cyl', y='drat', hue='am',
                data=df, kind='violin')
plt.savefig('saving-a-seaborn-plot-as-eps-file-300dpi.eps',
           dpi=300)Code language: Python (python)
Saving plots such as EPS, and TIFF (as we will learn about later) are also required or recommended (e.g., see the American Psychological Associations recommendations in their submission guidelines).
Saving the Seaborn Plot in Landscape (EPS)
In the final saving a plot to EPS example, we will use the orientation argument to save the Seaborn plot in the landscape.
sns.catplot(x='cyl', y='drat', hue='am',
                data=df, kind='violin')
plt.savefig('saving-a-seaborn-plot-as-eps-file-300dpi.eps', orientation="landscape",
           dpi=300)Code language: Python (python)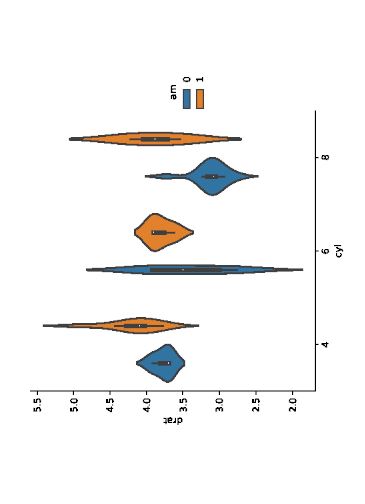
How to Save Seaborn plots to TIFF files
This section will use the final format to save the Seaborn plots. More specifically, we will save the plots in the Tagged Image File Format (TIFF). Now, as with the other formats, we will change the file ending (the fname argument) to .tiff. This will, as we now know, save the plot as a TIFF file.
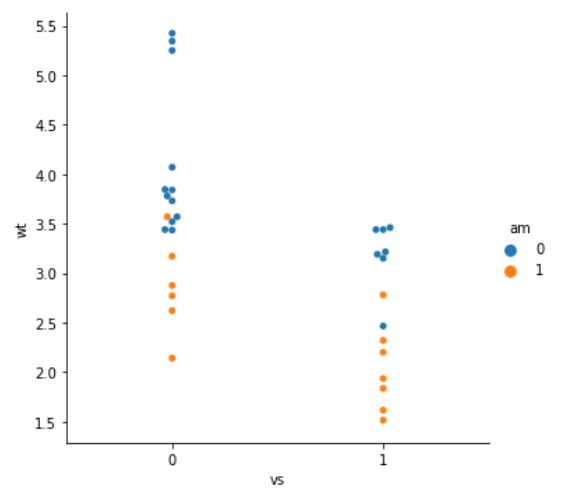
In the how-to save to a TIFF file example, we are going to continue working with the catplot method, but now we are going to create a swarm plot and save it as a TIFF file.
sns.catplot(x='vs', y='wt', hue='am',
                data=df, kind='swarm')
plt.savefig('saving-a-seaborn-plot-as-eps-file.tiff')Code language: Python (python)
Saving a Python (Swarm) Plot as a High-Resolution TIFF File
In the final, how to save a TIFF file example, we will save the Seaborn plot as a high-resolution TIFF file. Why? As previously mentioned, many scientific journals require, or recommend, that we use the PDF, EPS, or TIFF format when we submit our scientific papers.
Now, here’s how to export the Seaborn plot as a TIFF file with high resolution:
sns.catplot(x='vs', y='wt', hue='am',
                data=df, kind='swarm')
plt.savefig('saving-a-seaborn-plot-as-eps-file.tiff',
           dpi=300)Code language: JavaScript (javascript)
How to Save a Plot in Python Seaborn as an SVG File
In the final example, we will save a Seaborn figure as an SVG file. Now, we already know that we change the file ending to accomplish this:
sns.catplot(x='vs', y='wt', hue='am',
                data=df, kind='swarm')
plt.savefig('saving-a-seaborn-plot-as-eps-file.svg')Code language: Python (python)
Note, if we want to save the SVG file as a high-resolution SVG file, we would add the dpi=300 as we have learned in the previous examples.
Of course, a couple of other arguments could’ve been used when working with plt.savefig. However, when working with Seaborn, these are often redundant. The formatting is already handled, and we get quite nice-looking image files of our Seaborn plots.
Save a Seaborn Plot as a File: YouTube Tutorial
Here’s a YouTube tutorial going through most of the content in this post:
Conclusion: Saving Plots in Python to Files
In conclusion, mastering the art of saving a Seaborn figure as a file is important if you want to be able to publish your results. Throughout this guide, we have walked you through four steps to achieve this seamlessly.
Starting with the initial step, you learned the significance of importing the necessary libraries to set the foundation for your visualizations. Once you have crafted your plot, we showed you how to use the plt.savefig. This method enables us to save a Seaborn figure in diverse file formats – from the common PNG and PDF to the versatile EPS and SVG.
By skillfully wielding these techniques, you can save a Seaborn figure as a file, ensuring your visualizations are not confined to screens but transformed into tangible assets. This newfound ability empowers you to share your insights, presentations, and reports in formats suitable for various platforms and mediums.
I encourage you to take the next step – share this comprehensive guide on saving Seaborn figures as files with your peers and colleagues. Doing so contributes to a community of learners who value efficient data communication and visualization. Your feedback and suggestions are invaluable to me, so please take a moment to leave your thoughts in the comments below. We can refine our techniques, explore innovative approaches, and elevate our data visualization prowess.
Resources
Here are some other tutorials that might come in handy:
- Coefficient of Variation in Python with Pandas & NumPy
- Python Scientific Notation & How to Suppress it in Pandas & NumPy
- Python Check if File is Empty: Data Integrity with OS Module
- How to Convert a Float Array to an Integer Array in Python with NumPy