This post will teach you how to carry out MANOVA in Python. In previous posts, we learned how to use Python to detect group differences on a single dependent variable. However, there may be situations in which we are interested in several dependent variables. In these situations, the simple ANOVA model is inadequate.
One way to examine multiple dependent variables using Python would be to carry out Multivariate ANOVA (MANOVA). That is, one ANOVA for each of these dependent variables. However, the more tests we conduct on the same data, the more we inflate the family-wise error rate (the greater the chance of making a Type I error).
This is where MANOVA comes in handy. MANOVA, or Multivariate Analysis of Variance, is an extension of Analysis of Variance (ANOVA). However, when using MANOVA, we have two or more dependent variables.
MANOVA and ANOVA are similar when it comes to some of the assumptions. That is, the data have to be:
- normally distributed dependent variables
- equal covariance matrices
Table of Contents
- Outline
- What is MANOVA?
- Prerequisites
- How to Carry out MANOVA in Python
- Conclusion: MANOVA in Python
- Resources
Outline
The outline of the post is as follows. Firstly, we will introduce the Multivariate Analysis of Variance (MANOVA) concept in Python, highlighting its significance in simultaneously analyzing multiple dependent variables. Next, we will use a practical MANOVA example to demonstrate its real-world application.
Before delving into MANOVA, we will discuss the key assumptions that must be met for accurate results. Understanding these assumptions is crucial for reliable interpretations. Additionally, we will outline the prerequisites, ensuring you have the necessary knowledge of Python and the Statsmodels package.
To start with MANOVA in Python, we will guide you through installing Statsmodels, the essential Python library for this analysis. Afterward, we will provide a step-by-step guide on maneuvering MANOVA in Python, empowering you to implement the technique in your projects.
In our Python MANOVA example, we will explore a dataset to showcase the technique’s capabilities in analyzing multivariate relationships. This hands-on example will solidify your understanding and enable you to apply MANOVA effectively to your datasets.
Throughout the post, we will emphasize the significance of MANOVA in various data analysis scenarios, such as experimental designs or survey responses. Understanding the power of MANOVA in Python will open new avenues for statistical exploration and hypothesis testing.
What is MANOVA?
First, we are going to have a brief introduction to what MANOVA is. MANOVA is the acronym for Multivariate Analysis of Variance. When analyzing data, we may encounter situations where we have there multiple response variables (dependent variables). As mentioned before, by using MANOVA, we can test them simultaneously.
MANOVA Example
Before getting into how to do a MANOVA in Python, let’s look at an example where MANOVA can be a useful statistical method. Assume we have a hypothesis that a new therapy is better than another, more common, therapy (or therapies, for that matter). In this case, we may want to look at the effect of therapies (independent variable) on the mean values of several dependent variables.
For instance, we may be interested in whether the therapies help for a specific psychological disorder (e.g., depression) while also wanting to know how they affect life satisfaction and lower suicide risk. In such an experiment, a MANOVA lets us test our hypothesis for all three dependent variables at once.
Assumptions of MANOVA
In this section, we will briefly discuss some of the assumptions of carrying out MANOVA. Certain conditions need to be considered.
- The dependent variables should be normally distributed within groups. In the example below, the dependent variables should be normally distributed within the different treatment groups.
- Homogeneity of variances across the range of predictors. This assumption can be tested in Python using Bartlett’s test or Levene’s test.
- Linearity between all pairs of dependent variables (e.g., between depression, life satisfaction, and suicide risk), all pairs of covariates, and all dependent variable-covariate pairs in each cell
Now, if you only have one dependent variable, two groups, and your data is not following the normal distribution there is still hope. You can, in fact, carry out non-parametric statistical tests such as the Mann-Whitney U test in Python, as well.
Prerequisites
To carry out MANOVA in Python you need to have the package statsmodels installed. Here you will learn how to install this Python package.
Installing Statsmodels
We can install Python packages with either conda or pip, for example. Here’s how to install statsmodels using pip:
pip install statsmodelsCode language: Bash (bash)Typically, it is considered good practice to install Python packages in virtual environments. Check this YouTube video for more information on how to install statsmodels in a virtual environment (both with pip and conda):
Note that we will also use Pandas to read a CSV file, but installing stats models will also install Pandas. In the next section, we will learn how to perform MANOVA using statsmodels.
How to Carry out MANOVA in Python
In this section, we will focus on how to conduct the Python MANOVA using Statsmodels. First, the first code example, below, we will import Pandas as pd. Second, we import the MANOVA class from statsmodels.multivariate.manova.
import pandas as pd
from statsmodels.multivariate.manova import MANOVACode language: Python (python)
Before carrying out the Python MANOVA we need some example data. This is why we use Pandas. In the next code chunk, we will read a CSV file from a URL using Pandas read_csv. We are also going to replace the dots (“.”) in the column names with underscores (“_”). If you need to learn more about cleaning your data see post data cleaning in Python with Pandas.
url = 'https://vincentarelbundock.github.io/Rdatasets/csv/datasets/iris.csv'
df = pd.read_csv(url, index_col=0)
df.columns = df.columns.str.replace(".", "_")
df.head()Code language: Python (python)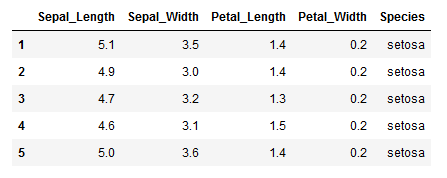
Learn more about working with Pandas dataframe:
- Pandas Read Excel Tutorial
- Read CSV files using Pandas
- How to Group Data using Pandas Groupby
- Pandas Dataframe Tutorial
Python MANOVA Example
Now that we have read a data file (e.g., a CSV file) using Pandas, we are ready to carry out the MANOVA in Python. In the Python MANOVA example below, we will use the from_formula method, which takes the formula as a string object.
In this MANOVA example, we will use the width and length columns as dependent variables. Furthermore, the species column is used as the independent variable. That is, we are carrying out a one-way MANOVA here:
maov = MANOVA.from_formula('Sepal_Length + Sepal_Width + \
                            Petal_Length + Petal_Width  ~ Species', data=df)Code language: Python (python)
Finally, we used Python to do a one-way MANOVA. The last thing to do is to print the MANOVA table using the mv_test method:
print(maov.mv_test())Code language: Python (python)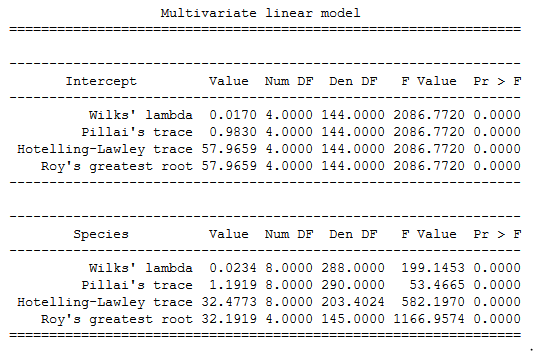
Here’s a link to a Jupyter Notebook containing the MANOVA Statsmodels example in this post. For a recent Python data analysis tutorial, check the post How to Perform a Two-Sample T-test with Python: 3 Different Methods.
Conclusion: MANOVA in Python
In this post, we have learned how to carry out MANOVA in Python, exploring its concepts, applications, and assumptions. A comprehensive example shows how MANOVA allows us to analyze multiple dependent variables simultaneously, providing deeper insights into complex data.
Before learning to do MANOVA, we covered the prerequisites, ensuring you have a solid foundation in Python and the necessary packages, including Statsmodels. With this post’s step-by-step guide, you have acquired the skills to conduct MANOVA, analyze results, and draw meaningful conclusions from your data.
Remember that understanding the assumptions of MANOVA is vital for accurate interpretation. Always validate these assumptions before applying the technique to ensure the reliability of your findings.
By learning MANOVA in Python, you can expand your data analysis toolkit and gain a powerful tool for exploring multivariate differences. Whether you are analyzing experimental data, survey responses, or any other multivariate dataset, MANOVA opens new possibilities for statistical hypotheses testing. If you liked this post, please share it with your friends and colleagues. Any suggestions or comments? Please write below.