In this short post, we are going to revisit the topic of how to carry out descriptive statistics in Python. In the previous post, I used Pandas (but also SciPy and Numpy, see Descriptive Statistics Using Python) but now we will only use Numpy. The descriptive statistics we will calculate are the central tendency (in this case only the mean), standard deviation, percentiles (25 and 75), min, and max.
Table of Contents
- Reading Data from CSV
- Descriptive statistics using Numpy
- The Results: Printing the Descriptive Statistics
Reading Data from CSV
In this example, I am going to use the Toothgrowth dataset (download here). It is pretty easy to load a CSV file using the genfromtxt method:
import numpy as np

data_file = 'ToothGrowth.csv'
data = np.genfromtxt(data_file, names=True, delimiter=",", dtype=None)Code language: Python (python)
Notice the arguments we pass. The first row has the names and that is why we set the argument ‘names’ to True. One of the columns, further, has strings. Setting ‘dtype‘ to None enables us to load both floats and integers into our data. Check out a more recent post in which you will learn how to convert float arrays to integer arrays in Python.
Descriptive statistics using Numpy
In the next code chunk, below, we are going to loop through each level of the two factors (i.e., ‘supp’, and ‘dose’) and create a subset of the data for each crossed level.
If you are familiar with Pandas, you may notice that subsetting a Numpy ndarray is pretty simple (data[data[yourvar] == level). The summary statistics are then appended into a list.
summary_stats = []
for supp_lvl in np.unique(data['supp']):

    for dose_lvl in np.unique(data['dose']):

        # Subsetting
        data_to_sum = data[(data['supp'] == supp_lvl) & (data['dose'] == dose_lvl)]
        # Calculating the descriptives
        mean = data_to_sum['len'].mean()
        sd = data_to_sum['len'].std()
        max_supp = data_to_sum['len'].max()
        min_supp =  data_to_sum['len'].min()
        ps = np.percentile(data_to_sum['len'], [25, 75] )
        summary_stats.append((mean, sd, max_supp, min_supp, ps[0], ps[1], supp_lvl, dose_lvl))Code language: Python (python)
If you prefer, you can convert the NumPy array to a Pandas dataframe. This way, you can use the dataframe methods to calculate the summary statistics instead. However, if you do and load your data from a .csv file, I’d suggest that you read the CSV file with Pandas read_csv method instead.
The Results: Printing the Descriptive Statistics
From the data list, we will create a Numpy array. The reason for doing this is that it will get us a bit prettier output. Especially, when we are setting the print options.
results = np.array(summary_stats, dtype=None)
np.set_printoptions(suppress=True)
print(results)Code language: Python (python)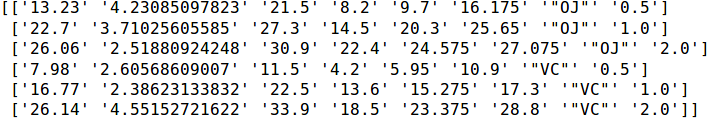
That was it. I still prefer doing my descriptives statistics using Pandas. Primarily, because of that, the output is much nicer but it’s also easier to work with Pandas dataframes compared to Numpy arrays.