In this post, we will have look at how to calculate the variance inflation factor in Python. We use this method to test for multicollinearity, which is the phenomenon where predictor variables are correlated. Multicollinearity can majorly impact the reliability of our results. To examine this issue, we can turn to the variance inflation factor, a powerful diagnostic tool to identify and address this. Detecting multicollinearity is important for accurate regression models, and Python provides robust tools for this task. Here we will explore the fundamentals of the variance inflation factor, understand its importance, and learn how to calculate it using Python using two methods.
Table of Contents
- Outline
- Prerequisites
- Multicollinearity
- Variance Inflation Factor
- Synthetic Data
- Python Packages to Calculate Variance Inflation Factor
- Variance Inflation Factor in Python with statsmodels
- Python to Manually Calculate the Variance Inflation Factor
- Conclusion
- Resources
Outline
The structure of the post is as follows. First, before we learn how to use Python to calculate variance inflation factor (VIF), we look at the issue of multicollinearity in regression analysis. Next, we learn about hte variance inflation factor and create synthetic data to with scenarios of high multicollinearity. Moving forward, we investigate the Python packages, focusing on Statsmodels and scikit-learn that can be used to diagnose our data..
Within Statsmodels, we will look at calculating variance inflation factor in Python, beginning with importing the vif method. In step two, we discuss the selection of predictors and the addition of a constant term. The final step will cover the actual computation of VIF in Python using Statsmodels.
To provide a comprehensive understanding, we also explore the manual calculation of VIF using scikit-learn. We conclude the post by summarizing key takeaways about multicollinearity and VIF, underlining their practical applications in Python for robust data analysis.
Prerequisites
Before we get into Python’s implementation of Variance Inflation Factor (VIF) and multicollinearity, ensure you have basic knowledge of regression analysis. Also, familiarity with predictor variables, response variables, and model building is important to foloow this post.
Moreover, a basic knowledge of Python programming and data manipulation using libraries like Pandas will be beneficial. Ensure you are comfortable with tasks such as importing data, handling dataframes, and performing fundamental statistical analyses in Python. If you still need to acquire these skills, consider using introductory Python for data analysis course, book, or tutorial.
Additionally, a conceptual understanding of multicollinearity—specifically, how correlated predictor variables can impact regression models—is essential. If these prerequisites are met, you are well-positioned to go on and learn how to calculate VIF in Python and effectively address multicollinearity issues in regression analysis.
Multicollinearity
When using regression models, understanding multicollinearity is important for, e.g., robust analyses. Multicollinearity occurs when independent variables in a regression model are highly correlated, posing challenges to accurate coefficient estimation and interpretation. This phenomenon introduces instability, making it difficult to discern the individual effect of each variable on the dependent variable. This, in turn, jeopardizes the reliability of statistical inferences we can draw from the model.
Moroever, coefficients become inflated, and their standard errors soar, leading to imprecise estimates. This inflation in standard errors could mask the true significance of variables, impeding the validity of statistical tests. Consequently, addressing multicollinearity is crucial for untangling these intricacies and ensuring the reliability of our results.
Variance Inflation Factor
Variance Inflation Factor (VIF) is a statistical metric that gauges the extent of multicollinearity among independent variables in a regression model. We can use it to quantify how much the variance of an estimated regression coefficient increases if predictors are correlated. This metric operates on the premise that collinear variables can inflate the variances of the regression coefficients, impeding the precision of the estimates. Thus, we can use the variance inflation factor to assess the severity of multicollinearity and identify problematic variables numerically.
The importance of VIF lies in its ability to serve as a diagnostic tool for multicollinearity detection. By calculating the VIF for each independent variable, we gain insights into the degree of correlation among predictors. Higher VIF values indicate increased multicollinearity, signifying potential issues in the accuracy and stability of the regression model. Monitoring VIF values enables practitioners to pinpoint variables contributing to multicollinearity, facilitating targeted interventions.
Interpreting VIF values involves considering their magnitudes concerning a predetermined threshold. Commonly, a VIF exceeding ten is indicative of substantial multicollinearity concerns1. Values below this threshold suggest a more acceptable level of independence among predictors. Understanding and applying these threshold values is instrumental in making informed decisions about retaining, modifying, or eliminating specific variables in the regression model.
Synthetic Data
Here are some synthetic data to demonstrate the calculation of the Variance Inflation Factor in Python:
import pandas as pd
import numpy as np

# Set a random seed for reproducibility
np.random.seed(42)

# Generate a dataset with three predictors
data = pd.DataFrame({
  'Predictor1': np.random.rand(100),
  'Predictor2': np.random.rand(100),
  'Predictor3': np.random.rand(100)
})

# Create strong correlation between Predictor1 and Predictor2
data['Predictor2'] = data['Predictor1'] + np.random.normal(0, 0.1, size=100)

# Create a Dependent variable
data['DependentVariable'] = 2 * data['Predictor1'] +
  3 * data['Predictor2'] +
  np.random.normal(0, 0.5, size=100)Code language: Python (python)
Python Packages to Calculate Variance Inflation Factor
Several Python libraries offer convenient tools for calculating Variance Inflation Factor (VIF) in the context of regression models. Two prominent libraries, statsmodels and scikit-learn, provide functions that streamline assessing multicollinearity.
Statsmodels
Statsmodels is a comprehensive library for estimating and analyzing statistical models. It features a dedicated function, often used in regression analysis, named variance_inflation_factor. This function enables us to compute VIF for each variable in a dataset, revealing insights into the presence and severity of multicollinearity. Statsmodels, as a whole, is widely employed for detailed statistical analyses, making it a versatile choice for researchers and analysts.
scikit-learn
On the other hand, scikit-learn, a well-used machine learning library, has modules extending beyond conventional machine learning tasks. While scikit-learn does not have a direct function for VIF calculation, its flexibility allows us to use alternative approaches. For instance, we can manually use the LinearRegression class to fit a model and calculate VIF. Scikit-learn’s strength lies in its extensive capabilities for machine learning applications, making it a valuable tool for data scientists engaged in diverse projects.
Variance Inflation Factor in Python with statsmodels
In this example, we will learn the practical process of calculating the Variance Inflation Factor (VIF) using the statsmodels library in Python. As previously mentioned, VIF is a crucial metric for assessing multicollinearity, and statsmodels provides a dedicated function, variance_inflation_factor, to streamline this calculation.
First, ensure you have the necessary libraries installed by using:
pip install pandas statsmodelsCode language: Bash (bash)Step 1: Import the Variance Inflation Factor Method
Now, let us consider a scenario with a dataset with multiple independent variables, such as in the synthetic data we previously generated. First, we start by loading the required methods:
from statsmodels.stats.outliers_influence import variance_inflation_factor
from statsmodels.tools.tools import add_constantCode language: Python (python)
Step 2: Select the Predictors and Add a Constant Term
Next, we will add a constant term to our independent variables, which is necessary for the VIF calculation in Python:
# Specify your independent variables
X = data[['Predictor1', 'Predictor2', 'Predictor3']]

# Add a constant
X = add_constant(X)Code language: PHP (php)
In the code chunk above, we prepare the independent variables for calculating the Variance Inflation Factor (VIF) in Python, specifically using the Statsmodels library. First, we specify our independent variables, denoted as ‘Predictor1’, ‘Predictor3’, and ‘Predictor4’. To facilitate the VIF calculation, we add a constant term to the dataset using the sm.add_constant() function from Statsmodels. This step is crucial for accurate VIF computation, ensuring the analysis considers the intercept term. The resulting dataset, now including the constant term, is ready for further analysis to assess multicollinearity among the independent variables.
Step 3: Calculate VIF in Python with Statsmodels
Now, it is time to use Python to calculate the VIF:
vif_data = pd.DataFrame()
vif_data['VIF'] = [variance_inflation_factor(X.values, i)
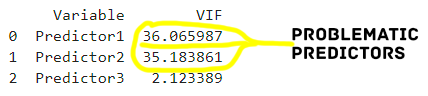
for i in range(X.shape[1])]Code language: Python (python)In the code chunk above, we use Pandas to create an empty DataFrame named vif_data to store information about the Variance Inflation Factor (VIF) for each variable. We then populate this dataframe by adding columns for the variable names and their corresponding VIF values. The VIF calculation is performed using a list comprehension, iterating through the columns of the input dataset X, and applying the variance_inflation_factor function. This function is part of the Statsmodels library and is employed to compute the VIF, a metric used to assess multicollinearity among predictor variables. The resulting vif_data DataFrame provides a comprehensive overview of the VIF values for each variable, aiding in the identification and interpretation of multicollinearity in the dataset. Herea the printed results:
Python to Manually Calculate the Variance Inflation Factor
In this section, we will use scikit-learn in Python to manually calculate the Variance Inflation Factor (VIF) by using linear regression. Here is how:
from sklearn.linear_model import LinearRegression
# Function to calculate VIF
def calculate_vif(data, target_col):
features = data.columns[data.columns != target_col]
X = data[features]
y = data[target_col]
# Fit linear regression model
lin_reg = LinearRegression().fit(X, y)
# Calculate VIF
vif = 1 / (1 - lin_reg.score(X, y))
return vif
# Calculate VIF for each predictor
vif_data = pd.DataFrame()
vif_data["Variable"] = X.columns
vif_data["VIF"] = [calculate_vif(data, col) for col in X.columns]
# Display the VIF values
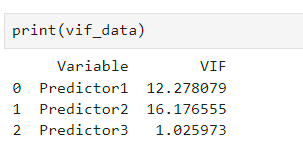
print(vif_data)Code language: Python (python)In the code chunk above, we define a Python function to calculate the Variance Inflation Factor (VIF) using scikit-learn’s Linear Regression. Moreover, the function takes a dataset and a target variable, fits a linear regression model, and computes the VIF for each predictor variable. Next, we store the results in a Pandas DataFrame, which is then printed to display the calculated VIF values for each predictor. This approach allows us to assess multicollinearity among variables in the dataset manually.
Conclusion
In this post, we have learned about the critical concept of multicollinearity in regression analysis and how the Variance Inflation Factor (VIF) is a valuable metric to detect and address. Understanding the consequences of multicollinearity on regression models is crucial for reliable statistical inferences. We explored Python libraries, such as Statsmodels and scikit-learn, to calculate VIF efficiently.
The synthetic data shows by an example how these techniques can be used putting emphasiaze the importance of identifying and mitigating multicollinearity for accurate regression analysis. Whether you are working with Statsmodels, scikit-learn, or manual calculations, the goal is to enhance the reliability of your predictive models.
As you apply these methods to your projects, share your insights and experiences in the comments below. Your feedback is valuable, and sharing this post on social media can help others in the data science community enhance their understanding of multicollinearity and its practical implications.
Resources
Here are some tutorials you might find helpful:
- Combine Year and Month Columns in Pandas
- Coefficient of Variation in Python with Pandas & NumPy
- MANOVA in Python Made Easy using Statsmodels
- Wilcoxon Signed-Rank test in Python
- How to use Pandas get_dummies to Create Dummy Variables in Python
- Seaborn Confusion Matrix: How to Plot and Visualize in Python