Random Intercept Model in R: Interpretation and Visualization

In this post, you will learn how to set up a random intercept model in R. This model is useful for analyzing data from experiments that involve repeated measurements of the same participants or items. It lets you control for variability in the outcome variable due to random effects, such as individual differences or item difficulty, while estimating the fixed effects of your predictors of interest. In this blog post, you will also learn how to use R to visualize a random intercept model.

Outline

More specifically, in this tutorial, you will learn:

  1. Installing and loading the necessary packages and preparing your data are prerequisites for running a random intercept model in R.
  2. How to carry out a random intercept model in R using the lmer() function from the lme4 package and interpret the output from the lmerTest package.
  3. How to visualize a random intercept model in R using the plot_model() function from the sjPlot package, and how to customize the plots to suit your needs.

Read more

Mann Whitney U Test in R: A Comprehensive Guide

Mann Whitney U test in R is a useful tool for comparing two independent samples when the parametric assumptions of the t-test are not met. For example, we might use it to compare the performance of two groups of participants on a cognitive task that produces ordinal or skewed data. In this post, we will explain how to perform and interpret the Mann Whitney U test in R and show some examples of its application in cognitive psychology. To perform the Mann Whitney U test we can use the `wilcoxon

Read more

Correlation in R: Coefficients, Visualizations, & Matrix Analysis

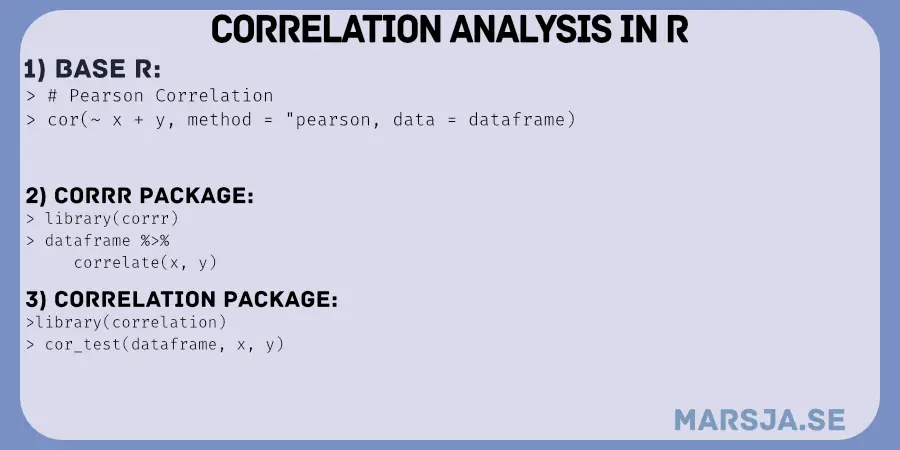
Correlation in R is a crucial skill to know and apply. It allows us to answer research questions concerning relationships between variables and, therefore, gain valuable insights from our datasets. This tutorial will explore how to do correlation in R, including calculating coefficients and constructing matrices. We will learn how to calculate correlation coefficients. Creating a correlation matrix in R will be another key focus of this post. This matrix offers a comprehensive overview of the correlations between multiple variables, aiding in identifying complex patterns and dependencies within our data.

Additionally, adequate visualization of correlations enhances our understanding of the data and makes the interpretation easier. We will look at visualization techniques that enable us to present patterns clearly and concisely, allowing us to grasp the relationships between variables at a glance. In the next section of the post, we will provide a detailed outline.

correlation analysis in R

Read more

Probit Regression in R: Interpretation & Examples

probit model in r

This blog post will teach us how to use probit regression in R, a statistical modeling technique for analyzing binary response variables. Probit regression can be useful when the outcome variable is dichotomous. That is when the outcome variable takes only two possible values, such as “success” or “failure,” “yes” or “no,” or “tinnitus” or “no tinnitus.”

We will start by exploring examples of when to use probit regression in R. Then, we will look at other alternatives and compare them to probit regression. We will also provide an example dataset that we can use to illustrate how to perform probit regression in R.

how to run a probit model in R
how to run a probit model in r

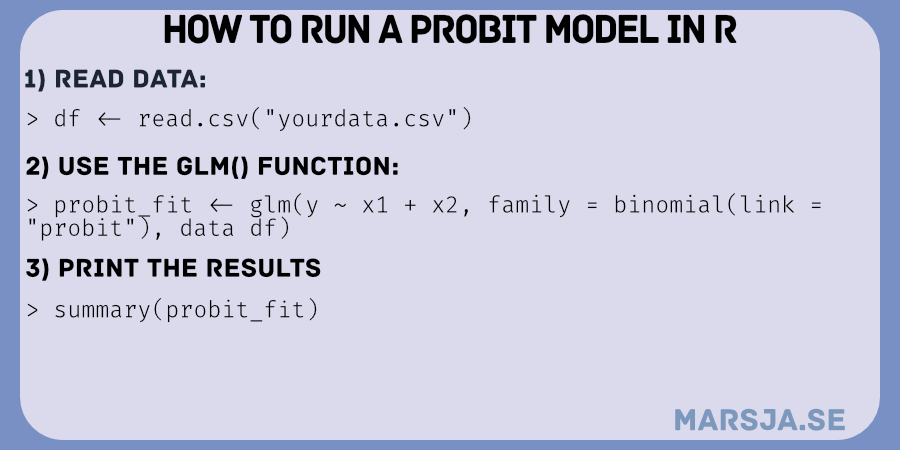
Once we have a dataset, we will dive into the syntax of building a probit model in R, explaining each step. We will also provide a complete example of probit regression in R to see how it fits together.

Read more

How to use Python to Perform a Paired Sample T-test

dependent sample t-test in Python

In this Python data analysis tutorial, you will learn how to perform a paired sample t-test in Python. First, you will learn about this type of t-test (e.g. when to use it, the assumptions of the test). Second, you will learn how to check whether your data follow the assumptions and what you can do if your data violates some of the assumptions. 

Read more

How to Perform Mann-Whitney U Test in Python with Scipy and Pingouin

In this data analysis tutorial, you will learn how to carry out a Mann-Whitney U test in Python with the packages SciPy and Pingouin. This test is also known as Mann–Whitney–Wilcoxon (MWW), Wilcoxon rank-sum test, or Wilcoxon–Mann–Whitney test and is a non-parametric hypothesis test.

Outline of the Post

This tutorial will teach you when and how to use this non-parametric test.  After that, we will see an example of a situation when the Mann-Whitney U test can be used. The example is followed by how to install the needed package (i.e., SciPy) as well as a package that makes importing data easy and that we can quickly visualize the data to support the interpretation of the results. In the following section, you will learn the two steps to carry out the Mann-Whitney-Wilcoxon test in Python. Note we will also look at another package, Pingouin, that enables us to carry out statistical tests with Python. Finally, we will learn how to interpret the results and visualize data to support our interpretation.

Read more

How to Perform a Two-Sample T-test with Python: 3 Different Methods

two sample t-test Python

In this Python data analysis tutorial, you will learn how to perform a two-sample t-test with Python. First, you will learn about the t-test including the assumptions of the statistical test. Following this, you will learn how to check whether your data follow the assumptions. 

After this, you will learn how to perform an two sample t-test using the following Python packages:

  • Scipy (scipy.stats.ttest_ind)
  • Pingouin (pingouin.ttest)
  • Statsmodels (statsmodels.stats.weightstats.ttest_ind)
  • Interpret and report the two-sample t-test
    • Including effect sizes

Read more

Create a Correlation Matrix in Python with NumPy and Pandas

In this post, we will calculate a correlation matrix in Python with NumPy and Pandas. Now, there will be several Python correlation matrix examples in this tutorial. First, we will read data from a CSV file so we can simply have a look at the numpy.corrcoef and Pandas DataFrame.corr methods.

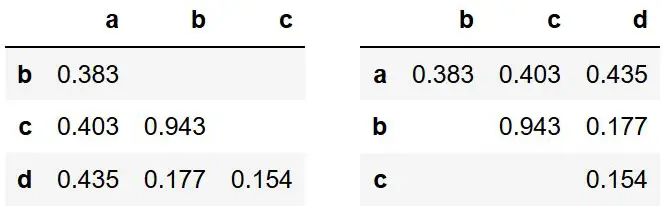
Python Correlation Tables - Lower and Upper Triangualar

Now, building a correlation table (matrix) comes in handy, especially if we have a lot of variables in our data (see three more reasons by reading further). At the post’s end is a link to a Jupyter Notebook with code examples.

Read more

How to use Pandas get_dummies to Create Dummy Variables in Python

Creating dummy variables in Python get_dummies() Pandas

In this post, we will learn how to use Pandas get_dummies() method to create dummy variables in Python. Dummy variables (or binary/indicator variables) are often used in statistical analyses and in more simple descriptive statistics. Towards the end of the post, you will find a link to a Jupyter Notebook containing all Pandas get_dummies() examples.

How to Create Dummy Variables in Python

To create dummy variables in Python with Pandas, we can use this code template:

# Creating dummy variables:
df_dc = pd.get_dummies(df, columns=['ColumnToDummyCode'])Code language: Python (python)

In the code chunk above, df is the Pandas dataframe, and we use the columns argument to specify which columns we want to be dummy code (see the following examples, in this post, for more details).

Read more: How to use Pandas get_dummies to Create Dummy Variables in Python

Dummy Coding for Regression Analysis

One statistical analysis in which we may need to create dummy variables in regression analysis. In fact, regression analysis requires numerical variables and this means that when we, whether doing research or just analyzing data, wishes to include a categorical variable in a regression model, supplementary steps are required to make the results interpretable.

Read more

MANOVA in Python Made Easy using Statsmodels

MANOVA in Python

This post will teach you how to carry out MANOVA in Python. In previous posts, we learned how to use Python to detect group differences on a single dependent variable. However, there may be situations in which we are interested in several dependent variables. In these situations, the simple ANOVA model is inadequate.

One way to examine multiple dependent variables using Python would be to carry out Multivariate ANOVA (MANOVA). That is, one ANOVA for each of these dependent variables. However, the more tests we conduct on the same data, the more we inflate the family-wise error rate (the greater the chance of making a Type I error).

This is where MANOVA comes in handy. MANOVA, or Multivariate Analysis of Variance, is an extension of Analysis of Variance (ANOVA). However, when using MANOVA, we have two or more dependent variables.

MANOVA and ANOVA are similar when it comes to some of the assumptions. That is, the data have to be:

  • normally distributed dependent variables
  • equal covariance matrices

Outline

The outline of the post is as follows. Firstly, we will introduce the Multivariate Analysis of Variance (MANOVA) concept in Python, highlighting its significance in simultaneously analyzing multiple dependent variables. Next, we will use a practical MANOVA example to demonstrate its real-world application.

Before delving into MANOVA, we will discuss the key assumptions that must be met for accurate results. Understanding these assumptions is crucial for reliable interpretations. Additionally, we will outline the prerequisites, ensuring you have the necessary knowledge of Python and the Statsmodels package.

To start with MANOVA in Python, we will guide you through installing Statsmodels, the essential Python library for this analysis. Afterward, we will provide a step-by-step guide on maneuvering MANOVA in Python, empowering you to implement the technique in your projects.

In our Python MANOVA example, we will explore a dataset to showcase the technique’s capabilities in analyzing multivariate relationships. This hands-on example will solidify your understanding and enable you to apply MANOVA effectively to your datasets.

Throughout the post, we will emphasize the significance of MANOVA in various data analysis scenarios, such as experimental designs or survey responses. Understanding the power of MANOVA in Python will open new avenues for statistical exploration and hypothesis testing.

Read more