In this short tutorial, we will learn how to change Seaborn plot size. For many reasons, we may need to either increase the size or decrease the size, of our plots created with Seaborn. For example, if we are planning on presenting the data on a conference poster, we may want to increase the size of the plot.
How to Make Seaborn Plot Bigger
Now, if we only to increase Seaborn plot size we can use matplotlib and pyplot. Here’s how to make the plot bigger:
import matplotlib.pyplot as plt
fig = plt.gcf()

# Change seaborn plot size
fig.set_size_inches(12, 8)Code language: Python (python)
Note, that we use the set_size_inches() method to make the Seaborn plot bigger.
When do We Need to Change the Size of a Plot?
One example, for instance, when we might want to change the size of a plot could be when we are going to communicate the results from our data analysis. In this case, we may compile the descriptive statistics, data visualization, and results from data analysis into a report, or manuscript for scientific publication.
Here, we may need to change the size so it fits the way we want to communicate our results. Note, for scientific publication (or printing, in general) we may want to also save the figures as high-resolution images.
First, before learning how to install Seaborn, we will briefly discuss this Python package. This Python package is, obviously, a package for data visualization in Python. Furthermore, it is based on matplotlib and provides us with a high-level interface for creating beautiful and informative statistical graphics. It is easier to use compared to Matplotlib and, using Seaborn, we can create a number of commonly used data visualizations in Python.
Now, whether you want to increase, or decrease, the figure size in Seaborn you can use matplotlib.
fig = plt.gcf()
fig.set_size_inches(x, y). Note this code needs to be put above where you create the Seaborn plot.
How to Install Python Packages
Now, if we want to install Python packages we can use both conda and pip. Conda is the package manager for the Anaconda Python distribution and pip is a package manager that comes with the installation of Python. Both of these methods are quite easy to use: conda install -c anaconda seaborn and pip -m install seaborn will both install Seaborn and it’s dependencies using conda and pip, respectively. Here’s more information about how to install Python packages using Pip and Conda.
Changing the Size of Seaborn Plots
In this section, we are going to learn several methods for changing the size of plots created with Seaborn. First, we need to install the Python packages needed. Second, we are going to create a couple of different plots (e.g., a scatter plot, a histogram, a violin plot). Finally, when we have our different plots we are going to learn how to increase, and decrease, the size of the plot and then save it to high-resolution images.
How to Change the Size of a Seaborn Scatter Plot
In the first example, we are going to increase the size of a scatter plot created with Seaborn’s scatterplot method. First, however, we need some data. Conveniently, Seaborn has some example datasets that we can use when plotting. Here, we are going to use the Iris dataset and we use the method load_dataset to load this into a Pandas dataframe.
import seaborn as sns

iris_df = sns.load_dataset('iris')

iris_df.head()Code language: Python (python)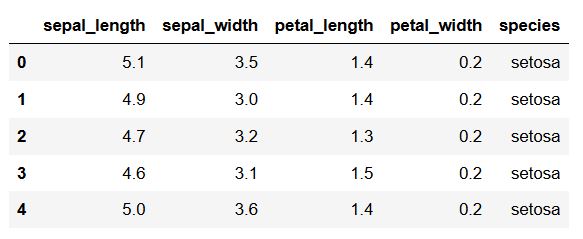
In the code chunk above, we first import seaborn as sns, we load the dataset, and, finally, we print the first five rows of the dataframe. Now that we have our data to plot using Python, we can go one and create a scatter plot:
%matplotlib inline

sns.scatterplot(x='sepal_length',
                y='petal_length',
                data=iris_df)Code language: Python (python)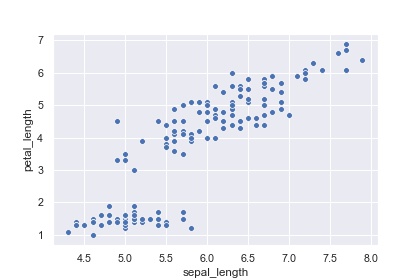
import matplotlib.pyplot as plt

fig = plt.gcf()

# Change seaborn plot size
fig.set_size_inches(12, 8)

sns.scatterplot(x='sepal_length',
                y='petal_length',
                data=iris_df)Code language: Python (python)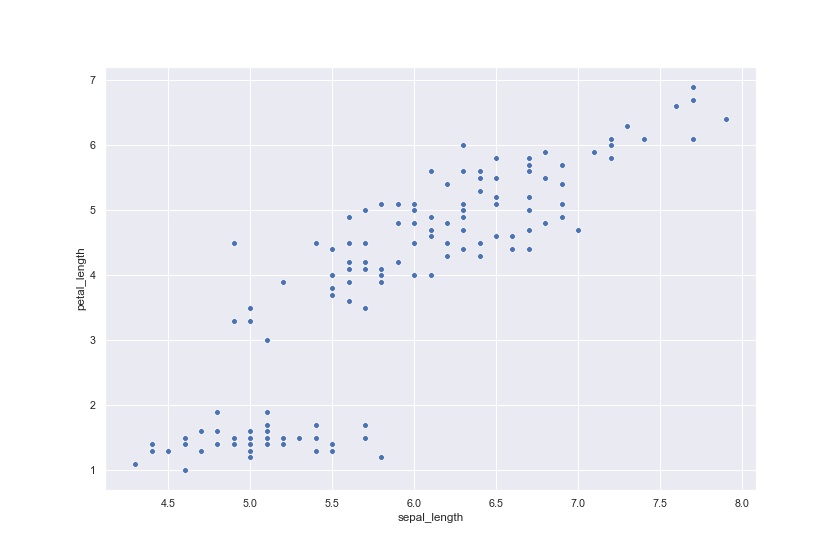
- There’s more in-depth information on how to create a scatter plot in Seaborn in an earlier Python data visualization post.
- If we need to explore relationship between many numerical variables at the same time we can use Pandas to create a scatter matrix with correlation plots, as well as histograms, for instance.
How to Change the Size of a Seaborn Catplot
In this section, we are going to create a violin plot using the method catplot. Now, we are going to load another dataset (mpg). This is, again, done using the load_dataset method:
mpg_df = sns.load_dataset('mpg')
mpg_df.head()Code language: Python (python)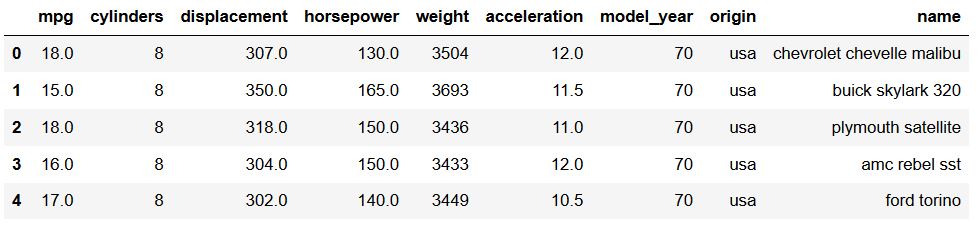
Now, when working with the catplot method we cannot change the size in the same manner as when creating a scatter plot.
g = sns.catplot(data=cc_df, x='origin', kind="violin",
                y='horsepower', hue='cylinders')
g.fig.set_figwidth(12)
g.fig.set_figheight(10)Code language: Python (python)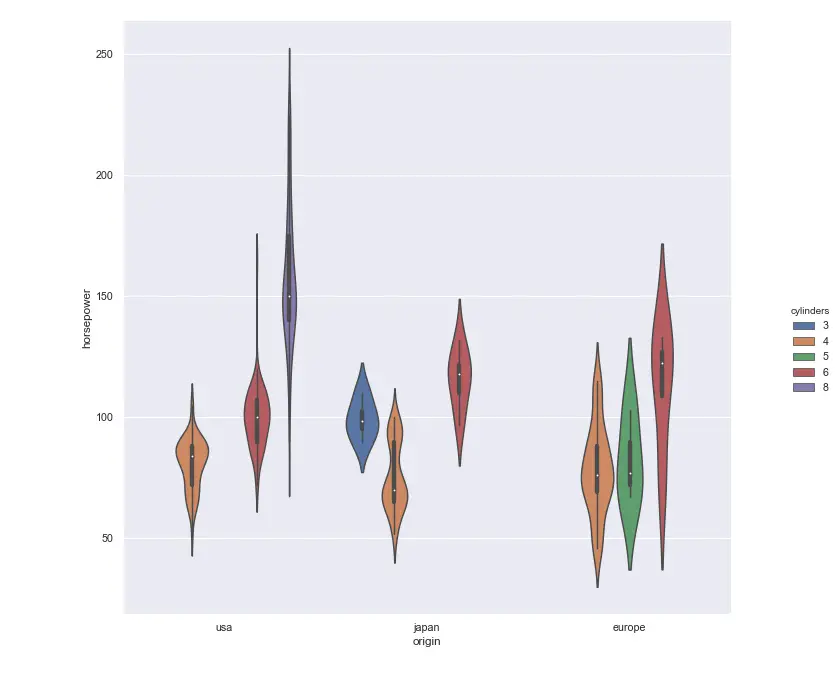
Now, as you may understand now, Seaborn can create a lot of different types of datavisualization. For instance, with the sns.lineplot method we can create line plots (e.g., visualize time-series data).
Changing the Font Size on a Seaborn Plot
As can be seen in all the example plots, in which we’ve changed Seaborn plot size, the fonts are now relatively small. We can change the fonts using the set method and the font_scale argument. Again, we are going to use the iris dataset so we may need to load it again.
In this example, we are going to create a scatter plot, again, and change the scale of the font size. That is, we are changing the size of the scatter plot using Matplotlib Pyplot, gcf(), and the set_size_inches() method:
iris_df = sns.load_dataset('iris')

fig = plt.gcf()

# Changing Seaborn Plot size
fig.set_size_inches(12, 8)

# Setting the font scale
sns.set(font_scale=2)
sns.scatterplot(x='sepal_length',
                y='petal_length',
                data=iris_df)Code language: Python (python)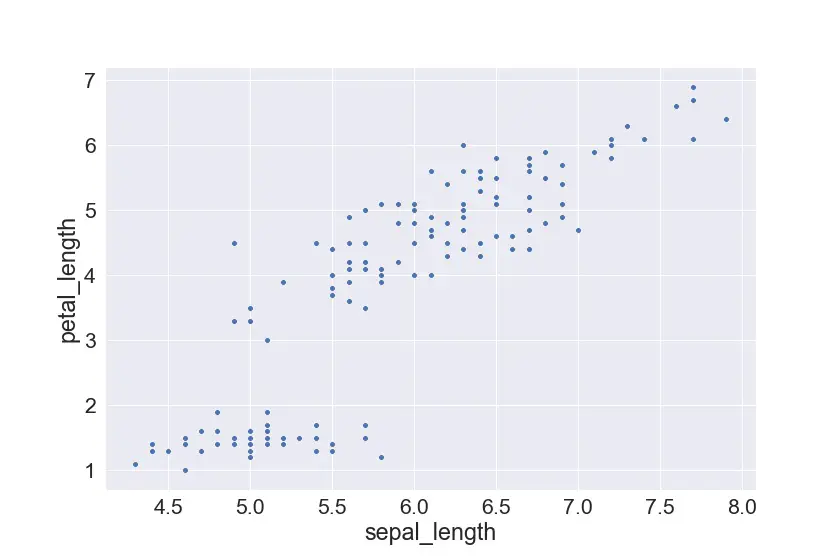
Saving Seaborn Plots
Finally, we are going to learn how to save our Seaborn plots, that we have changed the size of, as image files. This is accomplished using the savefig method from Pyplot and we can save it as a number of different file types (e.g., jpeg, png, eps, pdf). In this section, we are going to save a scatter plot as jpeg and EPS. Note, EPS will enable us to save the file in high-resolution and we can use the files e.g. when submitting to scientific journals.
Saving a Seaborn Plot as JPEG
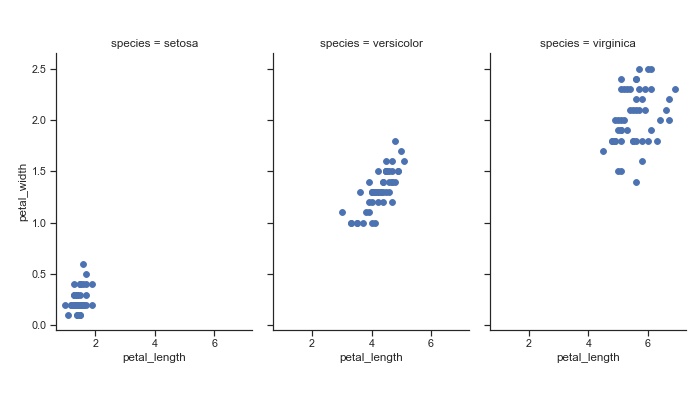
In this section, we are going to use Pyplot savefig to save a scatter plot as a JPEG. First, we create 3 scatter plots by species and, as previously, we change the size of the plot. Note, we use the FacetGrid class, here, to create three columns for each species.
import matplotlib.pyplot as plt
import seaborn as sns

iris_df = sns.load_dataset('iris')
sns.set(style="ticks")
g = sns.FacetGrid(iris_df, col="species")
g = g.map(plt.scatter, "petal_length", "petal_width")
g.fig.set_figheight(6)
g.fig.set_figwidth(10)

plt.savefig('our_plot_name.jpg', format='jpeg', dpi=70)Code language: Python (python)
In the code chunk above, we save the plot in the final line of code. Here, the first argument is the filename (and path), we want it to be a jpeg and, thus, provide the string “jpeg” to the argument format. Finally, we added 70 dpi for the resolution. Note, dpi can be changed so that we get print-ready Figures.
Saving a Seaborn Plot as EPS
In this last code chunk, we are creating the same plot as above. Note, however, how we changed the format argument to “eps” (Encapsulated Postscript) and the dpi to 300. This way we get our Seaborn plot in vector graphic format and in high-resolution:
import matplotlib.pyplot as plt
import seaborn as sns

iris_df = sns.load_dataset('iris')
sns.set(style="ticks")
g = sns.FacetGrid(iris_df, col="species")
g = g.map(plt.scatter, "petal_length", "petal_width")

plt.savefig('our_plot_name.eps', format='eps', dpi=300)Code language: Python (python)
For a more detailed post about saving Seaborn plots, see how to save Seaborn plots as PNG, PDF, PNG, TIFF, and SVG.
Conclusion
In this post, we have learned how to change the size of the plots, change the size of the font, and how to save our plots as JPEG and EPS files. More specifically, here we have learned how to specify the size of Seaborn scatter plots, violin plots (catplot), and FacetGrids.
Comment below, if there are any questions or suggestions to this post (e.g., if some techniques do not work for a particular data visualization technique).