Here is a coefficient of variation calculator with mean, standard deviation (SD), and variance:
In the following sections, you will learn how to effectively utilize the Coefficient of Variation (CV) Calculator. The step-by-step guide illustrates how to use the calculator through simple copy-pasting of data. Additionally, you will find information on how to upload your data in CSV format to the calculator. Both methods ensure a smooth and efficient process for calculating your dataset’s CV, mean, standard deviation, and variance, enabling you to gain valuable insights into your data’s variability. To open the calculator in a new window, click here.
Table of Contents
- How to use the Coefficient of Variation Calculator
- The Coefficient of Variation
- Frequently Asked Questions
- Conclusion
How to use the Coefficient of Variation Calculator
The CV Calculator provides two convenient ways to input data:
- Copy-paste data directly into the text area, where commas separate columns.
- Upload a CSV file containing comma-separated data.
Additionally, you can specify a grouping variable by selecting one of the columns from the dataset. This feature allows for calculating the coefficient of variation within different groups or conditions.
Whether you prefer the copy-paste method or file upload, the CV Calculator enables you to assess data variability using the coefficient of variation metric quickly. Gain valuable insights into the relative variability of your dataset and make informed decisions based on the results.
Method 1: Copy-Pasting Data into the Coefficient of Variation Calculator
This method, of using the CV calculator, requires your data to be comma-separated. Here is how your data should be formatted:
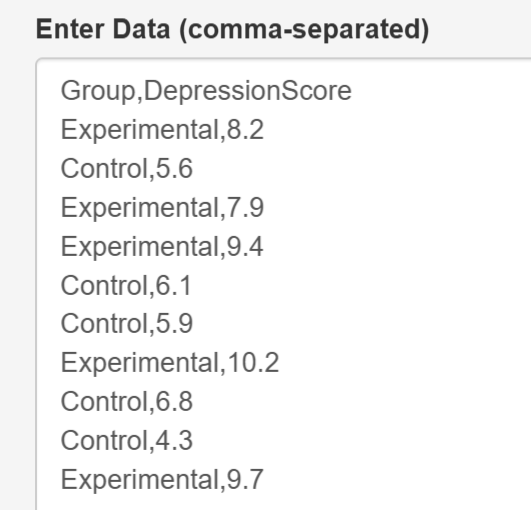
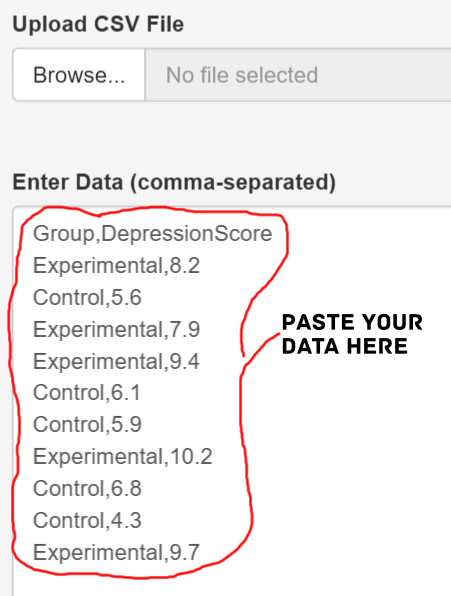
Step 1: Paste your Data
The CV Calculator’s first step is to copy-paste your data into the designated field. Select and copy the data from your source, such as a spreadsheet or text document. Then, navigate to the CV calculator tool and locate the input field to paste the data. See the image below as a reference.
Once you have pasted the data, the CV calculator will recognize the columns separated by commas and automatically process the information. Review the pasted data to ensure its accuracy and make necessary adjustments.
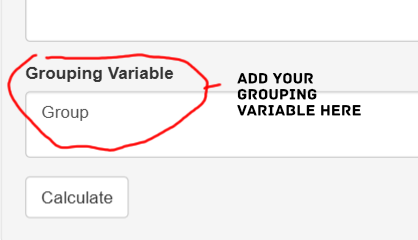
Step 2 (Optional): Adding Grouping Variables
In this optional step, you can add grouping variables to your data if applicable. Grouping variables allow you to analyze the coefficient of variation (CV) within different groups, providing deeper insights into the variability of your data.
To add grouping variables, select the desired column(s) from your pasted data and enter them into the designated field in the CV Calculator. You can choose multiple columns as grouping variables (e.g., “Group” and “Condition”) to perform a comprehensive analysis.
Adding grouping variables lets you see how different subsets of your data exhibit varying levels of variability. This feature helps you discover patterns, identify relationships, and make informed conclusions based on the variability of each group.
Step 3: Calculate the Coefficient of Variation, Mean, Standard Deviation, & Variance
In the final step, the CV Calculator will process your data, considering any grouping variables you have added (if you added any). It will then calculate the coefficient of variation, mean, standard deviation, and variance for all numeric values in your dataset.
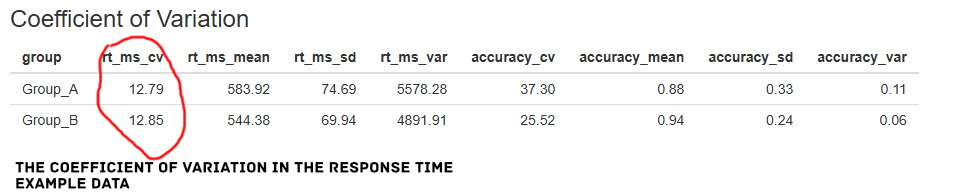
With this information, you can understand the variability in your data and how it relates to the mean and standard deviation. The calculated statistics provide valuable insights into the distribution of your data and enable you to make data-driven decisions confidently. Here is the output from the coefficient of variation calculator:
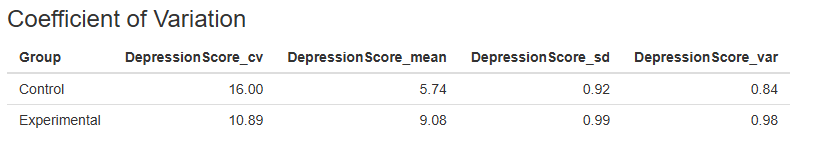
The calculator output displays grouping variables followed by CV, mean, SD, and variance. Numeric variables are grouped in columns. In the following section, you will find a guide on using your data to upload a comma-separated file (CSV).
Method 2: Uploading Data into the Coefficient of Variation Calculator
Here is the second method for using the coefficient of variation calculator to get the CV, mean, standard deviation, and variance.
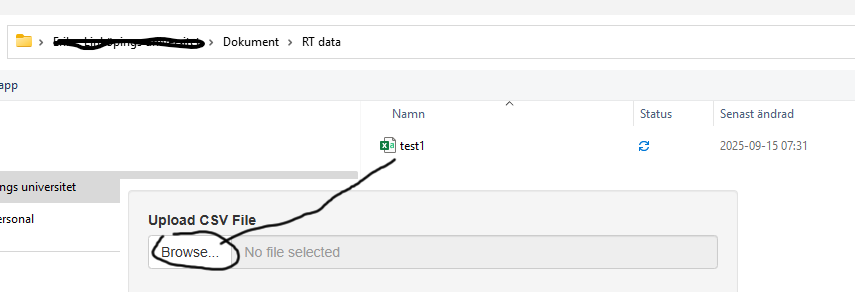
Step 1: Upload your Data
First, to upload data into the CV Calculator, ensure your data is in CSV format. Save the CSV file on your hard drive. Next, click the “Browse” button in the calculator to locate the CSV file.
Step 2 (Optional): Adding Grouping Variables
In this step, you can include grouping factors if applicable. Grouping variables enables CV analysis within distinct subsets, gett ing more out of your data.
Please select the desired columns from your uploaded dataset to add grouping variables and enter them in the designated field. You can choose multiple columns as grouping variables, such as “Group” and “Condition,” to conduct a comprehensive analysis. This step parallels copy-pasting data, maintaining the same user-friendly approach.
Step 3: Calculate the CV, Mean, Standard Deviation, & Variance
The third and final step involves processing your data using the CV Calculator, considering any added grouping variables. The calculator computes the coefficient of variation, mean, standard deviation, and variance for all numeric values.
The output presents grouping variables, followed by CV, mean, SD, and variance. Numeric variables are conveniently grouped in columns. This step mirrors the earlier process of copy-pasting data into the calculator, ensuring consistency in user experience.
Understanding the variability, relationship to mean, and SD empowers you to make data-driven decisions confidently. The statistics provide valuable insights into your data distribution and support informed conclusions.
With the comprehensive output at your disposal, you gain a clearer understanding of your data’s characteristics and can navigate its patterns effectively.
The Coefficient of Variation
The coefficient of variation (CV) is a statistical measure used to assess the relative variability of a dataset. It expresses the standard deviation as a percentage of the mean, enabling comparisons between datasets with different scales. The CV is particularly valuable when comparing datasets with distinct units or magnitudes.
The coefficient of variation is a tool for assessing the stability and consistency of data. It is commonly employed in various fields, such as finance, engineering, and science, to evaluate the reliability of measurements. We, as researchers and analysts, use it to determine the degree of dispersion in data, identify outliers, and make informed decisions based on the variability of the dataset.
The formula to calculate the CV is straightforward: CV = (Standard Deviation / Mean) * 100%. To compute it, first, calculate the mean and standard deviation of the dataset. Then, divide the standard deviation by the mean and multiply the result by 100 to obtain the CV as a percentage.
The CV’s output provides essential insights into the dataset’s stability. A higher CV indicates higher relative variability, while a lower CV suggests greater consistency. By understanding the CV, you can effectively evaluate and compare datasets, leading to more robust analyses and data-driven decisions.
Frequently Asked Questions
The coefficient of variation (CV) is a statistical measure that represents the relative variability of a dataset. It is expressed as a percentage and provides insights into the dispersion or spread of data points from the mean. CV is a dimensionless number, making it valuable for comparing the variability of different datasets, especially when they have different scales or units.
In essence, the CV helps you understand the stability and consistency of data. A low CV indicates that the data points are closely clustered around the mean, suggesting greater precision and reliability. Conversely, a high CV suggests greater variability, showing potential fluctuations or uncertainties in the dataset.
Calculating the coefficient of variation (CV) is a straightforward process. Follow these steps:
1. Find the dataset’s mean (average) and standard deviation.
2. Divide the standard deviation by the mean.
3. Multiply the result by 100 to express it as a percentage.
The formula for CV is: CV = (Standard Deviation / Mean) * 100%. For example, if a dataset has a mean of 50 and a standard deviation of 10, the CV would be (10 / 50) * 100% = 20%
The coefficient of variation (CV) provides valuable insights into the relative variability of a dataset in comparison to its mean. It helps analysts and researchers understand the consistency and stability of the data points. A low CV indicates that the data is relatively uniform and precise, with data points closely clustered around the mean. On the other hand, a high CV suggests that the data is more dispersed, with greater variability around the mean.
The CV is particularly useful for comparing datasets with different scales or units, as it represents a dimensionless number as a percentage. It allows you to assess the relative risk and uncertainty associated with different datasets. In scientific studies, the CV is commonly used to evaluate the precision and reliability of experimental measurements.
Conclusion
In conclusion, the Coefficient of Variation Calculator provides a powerful tool for analyzing and understanding the variability of your data. Whether you copy-paste your data directly into the calculator or upload it in CSV format, the calculator efficiently processes your dataset to calculate the CV, mean, standard deviation, and variance. By incorporating grouping variables, you can get more from your data, examining variability within different subsets and find insightful patterns and relationships.
This user-friendly calculator was created using R and Shiny App, ensuring robustness and accuracy in the calculations. If you encounter any issues or have questions about using the calculator, please don’t hesitate to comment below. I value your feedback and strive to improve your experience continuously.
If you found this tool helpful, consider sharing it with others who might benefit from its insights. Together, we can make data analysis more accessible and intuitive. Additionally, if you want to learn more about calculating the coefficient of variation in R, check out our comprehensive guide in the following post: Coefficient of Variation in R.