In this short tutorial, you will learn how to convert a matrix to a dataframe in R. Specifically, you will learn how to use base R and the package tibble to change the matrix to a dataframe. You will learn this task using four examples (2 using each method).
This post is structured as follows. First, you will learn briefly about tibble and how to install this R package. After this, you will get the answer to the question, “How do I convert a matrix to a dataframe in R”. In the next section, we will create a simple matrix. The following sections, of the blog post, will be converted to a dataframe in different examples throughout the post. These examples will, hopefully, deepen your knowledge concerning converting matrices in R.
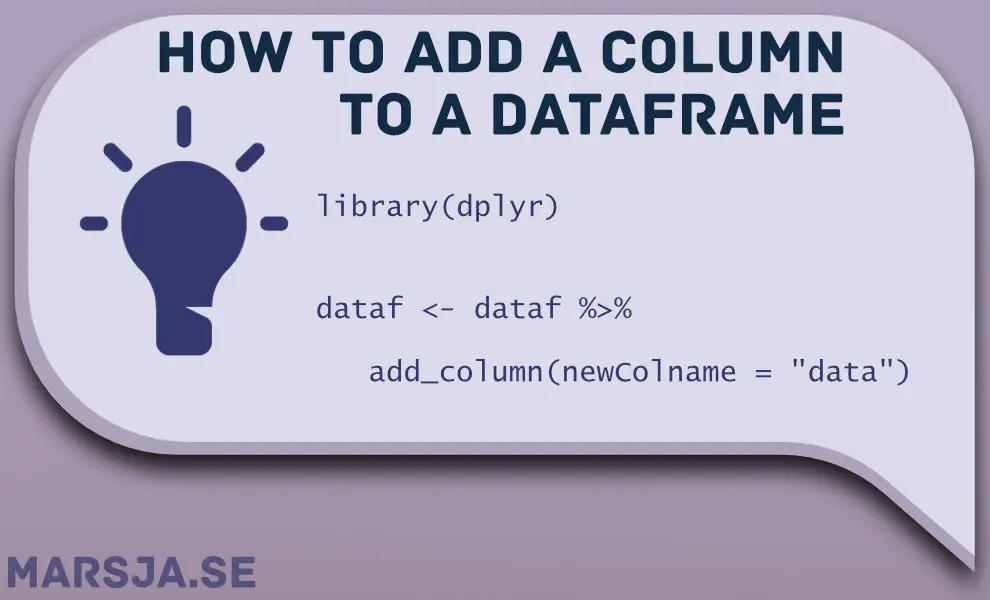
In this brief tutorial, you will learn how to add a column to a dataframe in R. More specifically, you will learn 1) to add a column using base R (i.e., by using the $-operator and brackets, 2) to add a column using the add_column() function (i.e., from tibble), 3) to add multiple columns, and 4) to add columns from one dataframe to another.
How to add column to dataframe
In Psychological research, there are instances when we need to merge data from different sources. For example, suppose we have collected data on participants’ personality traits using a self-report questionnaire and their performance on a cognitive task. The personality data may be stored in one dataframe, while the cognitive task data is in another dataframe. To analyze the relationship between personality and cognitive performance, we need to combine these datasets. In such cases, we may need to add a column from one DataFrame to another in R. By adding a column from one dataframe, containing the personality data, to the dataframe with cognitive task data, we can create a unified dataset. This allows us to investigate how individual personality differences relate to cognitive performance. Adding a column to a dataframe in R provides us with the flexibility to merge and integrate various data sources, enabling comprehensive analyses that consider multiple factors. This approach enhances the depth and richness of our understanding of psychological phenomena and facilitates more nuanced interpretations of research findings.
Note, when adding a column with tibble we are, as well, going to use the %>% operator which is part of dplyr. Note, dplyr, as well as tibble, has plenty of useful functions that, apart from enabling us to add columns, make it easy to remove a column by name from the R dataframe (e.g., using the select() function).
In this R tutorial, you will learn how to add a column to a dataframe based on values in other columns. Specifically, you will learn to create a new column using the mutate() function from the package dplyr and other useful functions.
Finally, we will also look at how to add the column, based on values in other columns, at a specific place in the dataframe. This will be done using the add_column() function from the Tibble package.
In this post, we will first learn how to install the r-packages we will use. Second, we will import example data that we can use and add columns based on conditions. After we have a dataframe, we will go on and look at how to add a column to the dataframe with values depending on other columns. In these sections, we will use the mutate() and add_column() functions to accomplish the same task. We will use these R functions to add a column based on conditions.
In this tutorial, you will learn how to extract year from date in R. You will learn by a couple of examples containing R code along with a description of the code. To know how to extract the year from DateTime may be needed when working with data containing datetime (e.g., 2020-08-24 10:34:00) and you want to do e.g. time series analysis but only want to use year.
As you may already know, R is a versatile statistical programming environment, and there are many ways to extract elements, such as year, from datetime. For example, we can separate year using the format() function. In this post, however, we need to start by converting a vector, or a column in a dataframe (e.g., to a POSIXct class) as well as use the lubridate package. It is, of course, possible to adapt the examples in this post to extract time, and to extract day.
In this short R tutorial, you will learn how to add an empty column to a dataframe in R. Specifically, you will learn 1) to add an empty column using base R, 2) to add an empty column using the add_column function from the package tibble and we are going to use a pipe (from dplyr). Now, dplyr comes with many handy functions that, apart from adding columns, make it easy to remove a column from the R dataframe (e.g., using the select() function). Both tibble and dplyr are part of the tidyverse package.