In this blog post, you will learn how to use data.table to sum multiple columns in R. The data.table package is efficient for working with large datasets, and summing multiple columns is a common data manipulation task. We have previously looked at how to sum columns using dplyr and base R functions. Now, we will focus on how to achieve the same result using data.table, including summing by groups and using the %in% operator.
In this post, we will learn how to sum rows in R, explore some techniques to calculate row-wise totals, and use both base R and the dplyr package. Similar to an earlier post discussing summing columns in R, we will now learn row-wise summations. First, we will use base functions like rowSums() and apply() to perform row-wise calculations. Here is a basic example of calculating the row sum in R: rowSums(dataframe).
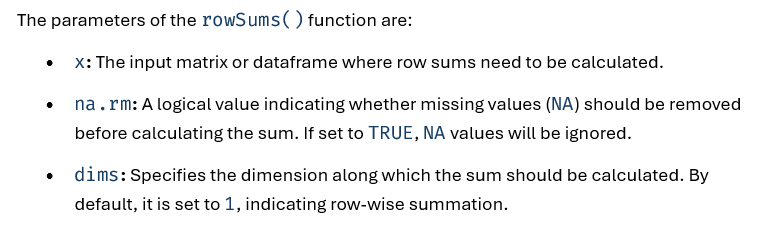
Syntax of the rowSums function in R.
We will also look at how to sum specific rows based on conditions, a key skill in data manipulation. This approach is essential when you want to aggregate values selectively, catering to various data analysis needs. Psychology, hearing science, and data science are domains where such techniques can aid us in finding meaningful patterns in research or survey data.
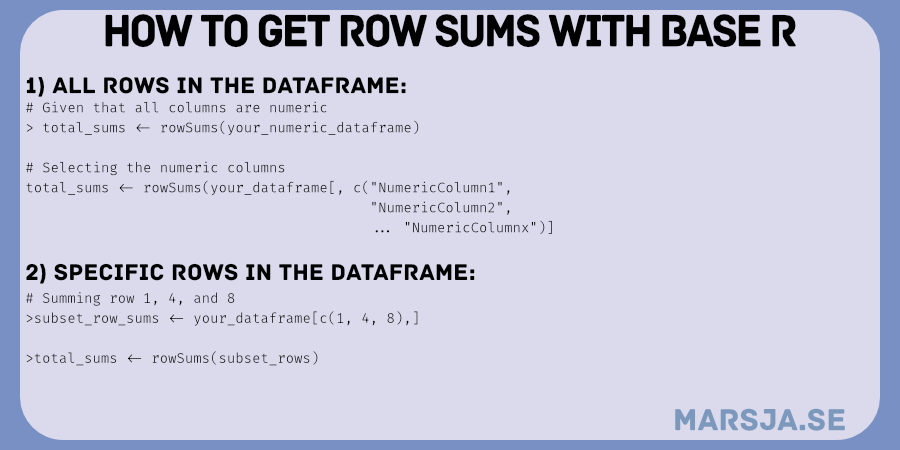
row sums with base R.
Expanding our capabilities, we will further utilize dplyr to sum rows in R, leveraging functions like mutate() and summarize(). This approach is highly efficient for larger datasets and complex calculations. The flexibility of dplyr allows us to integrate row-wise summation into data manipulation pipelines seamlessly.