Are you looking to learn how to manipulate and analyze data using Pandas? Then you have come to the right place! In this blog post, we will explore the power of the groupby method in Pandas allows us to group data based on one or more columns, and then perform various operations on each group.
In this post, we will start by explaining what groupby is and why it’s useful, and then provide examples of how to use groupby to perform simple data analysis tasks. We will also learn how to display and manipulate groupby objects, count values in each group, calculate missing values, and aggregate data by group using functions such as mean and median.
Moreover, you will also learn how to use groupby multiple columns, count multiple groups, calculate percentages, and save the resulting grouped data as a CSV or Excel file. By the end of this post, you will have a solid understanding of how groupby to analyze and manipulate your data in Pandas efficiently. So, let’s dive in!
- More about working with Pandas: Pandas Dataframe Tutorial
Table of Contents
- Importing Example Data
- Python Pandas Groupby Example
- Pandas Groupby Count
- Counting Missing Values per Group in Pandas
- Pandas Groupby Mean
- Median Score of a Group Using the groupby Method in Pandas
- Pandas Groupby Multiple Columns
- Pandas Groupby Count Multiple Groups
- Pandas groupby percentage
- Using groupby agg() Method with Multiple Groups
- Saving the Grouped Dataframe
- Conclusion:
Importing Example Data
First, we will import pandas as pd, and read a CSV file, using the read_csv method, to a dataframe. In the example below, we use index_col=0 because the first row in the dataset is the index column.
import pandas as pd

data_url = 'http://vincentarelbundock.github.io/Rdatasets/csv/carData/Salaries.csv'
df = pd.read_csv(data_url, index_col=0)

df.head()Code language: Python (python)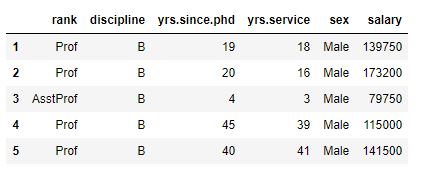
We used Pandas head to see the first five rows of our dataframe. In the image above, we can see that we have at least three variables by that we can group our data. That is, we can group our data by “rank”, “discipline”, and “sex”.
Of course, we could also group it by yrs.since.phd or yrs.service, but there may be many groups. As mentioned, we will use Pandas groupby to group a dataframe based on one, two, three, or more columns.
Data can be loaded from other file formats as well (e.g., Excel, HTML, JSON):
- Pandas Excel Tutorial: How to Read and Write Excel Files
- Explorative Data Analysis with Pandas, SciPy, and Seaborn includes a short introduction to Pandas read_html.
In this section, we briefly answer what is groupby in Pandas? We use the Pandas groupby() method to split the data into groups based on our specified criteria. If we need to group our data by, for instance, gender, we can type df.groupby(‘gender’) given that our dataframe is df and the column is gender. In this post, we will learn more examples of how to use groupby in Pandas.
Python Pandas Groupby Example
Now we are going to learn how to use Pandas groupby. This tutorial starts with the simplest example; grouping by one column. Specifically, in the Pandas groupby example below, we will group by the column “rank”.
We can use many different methods on the objects we get when using the groupby method (and Pandas dataframe objects). All available methods on a Python object can be found using this code:
import IPython

# Grouping by one factor
df_rank = df.groupby('rank')

# Getting all methods from the groupby object:
meth = [method_name for method_name in dir(df_rank)
     if callable(getattr(df_rank, method_name)) & ~method_name.startswith('_')]

# Printing the result
print(IPython.utils.text.columnize(meth))Code language: Python (python)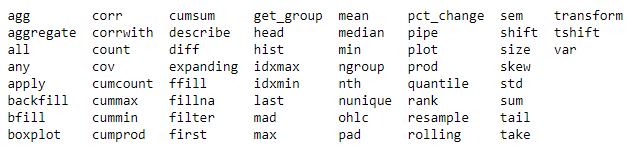
In the code chunk above, we group the data in a dataframe object called df by the ‘rank’ column using the groupby method.
Next, we create a list called meth by iterating over all the attributes of the groupby object, and selecting only the attributes that are callable and whose names do not start with an underscore (‘_’). This list will contain the names of all the available methods of the groupby object.
Finally, the columnize function from the IPython.utils.text module is used to format the list meth into multiple columns and print the formatted result to the console using the print statement. By doing this we get a readable output containing a list of available methods of the groupby object in a formatted columnar view. In the following examples, we will use some of these methods.
How to Display Pandas groupby Objects
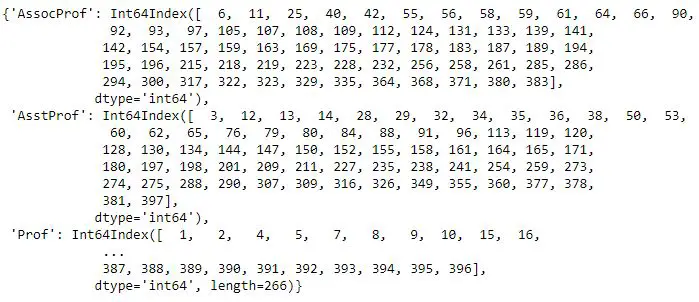
In this subsection, we will learn how to print a Pandas groupby object. First, we can print out the groups by using the groups method to get a dictionary of groups:
df_rank.groupsCode language: Python (python)In the code chunk above, we use the df_rank.groups, which is a dictionary where the keys are the unique values of the column(s) used to group the original dataframe df. Moreover, the values are arrays of the corresponding indices in df that belong to each group. df_rank.groups will return a dictionary where the keys are the unique grades in the ‘rank’ column, and the values are arrays of indices corresponding to each group of rank in the original dataframe df. Here is the output:
We can also use the groupby method get_group to filter the grouped data. In the following code example, we will select the Assistant Professor group (i.e., “AsstProf”).
# Get group
df_rank.get_group('AsstProf').head()Code language: Python (python)
In the code chunk above, we used df_rank.get_group('AsstProf'). By using this method of the groupby object df_rank we can retrieve a specific group of data from the original dataframe df that was grouped by a particular column or columns.
In this case, the method is being called with the argument 'AsstProf', which means it will return all the rows in the original dataframe df that belong to the ‘AsstProf’ group. Here is the result:
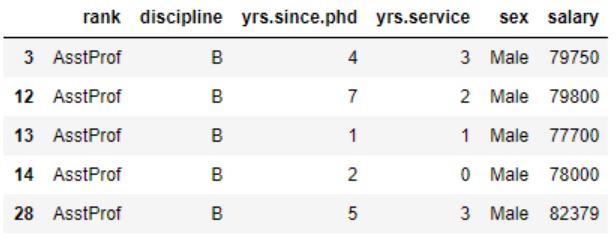
We used the.head() method to show only the first five rows of the ‘AsstProf’ group. Otherwise, the output would be hard to display.
If we want to print some parts of the groupby object we can use the head method:
df_rank.head()Code language: Python (python)In the YouTube video below, we are going through all the groupby in Pandas examples from above.
Pandas Groupby Count
In this section, we will continue working with the groupby method in Pandas. More specifically, we will learn how to count the number of occurrences across different groups.
1. Count by Group using Pandas size method
For example, if we want to find out how big each group is (e.g., how many observations there are in each group), we can use .size() to count the number of rows in each group:
df_rank.size()

# Output:
#
# rank
# AssocProf     64
# AsstProf      67
# Prof         266
# dtype: int64Code language: Python (python)
In the code chunk above, we used Pandas, df_rank.size(). This is a method that we use to calculate the size of each group in the dataframe df that was previously grouped by a column “rank”. The .size() method returns a Series object with the group names as index and the group sizes as values.
This method is useful for quickly getting an idea of the distribution of data among the groups, or for selecting specific groups based on their size, for instance, filtering out groups with fewer than a certain number of data points.
2. Group by Column and Count in Pandas Dataframe
Additionally, we can also use the .count() method to count by group(s) and get the entire dataframe. If we don’t have any missing values, the number should be the same for each column and group. Thus, by using Pandas to group the data, like in the example here, we can explore the dataset and see if there are any missing values in any column.
# N in each group
df_rank.count()Code language: Python (python)
In the code chunk above, we used the df_rank.count() method. This method will return a dataframe with the count of non-null values for each column of the original dataframe df in each group. Here is the output:
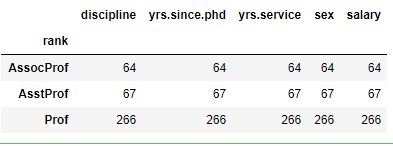
The .size() method is useful for quickly calculating summary statistics on each group of the dataframe, such as the number of non-null values in each column for each group. We can use the method to e.g., identify missing values, impute them, or perform further data analysis on each group.
That was how to use Pandas .size() and .count() methods to count the number of rows in each group. We will return to this later when we are grouping by multiple columns.
3. Count the Number of Unique Values by Group in Pandas
In some cases, we may want to determine the number of unique values in each group. This can be done using the groupby method nunique:
# Counting each group
df_rank.nunique()Code language: Python (python)
df_rank.nunique() is a method that returns a dataframe with the count of unique values for each column of the original dataframe df in each group. This method is useful for quickly identifying the number of unique values in each column for each group, which can provide insight into the distribution of values within each group. We can use this method to identify duplicates, perform data cleaning, or perform further analysis on each group.
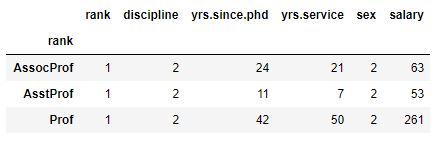
As can be seen in the last column (salary), there are 63 Associate Professors, 53 Assistant Professors, and 261 Professors in the dataset. If you’re only interested in using Pandas to count the occurrences in a column you can instead use value_counts().
Counting Missing Values per Group in Pandas
In this example, we have a complete dataset, and we can see that some have the same salary (e.g., there are 261 unique values in the column salary for Professors). If we have missing values in the dataframe we would get a different result.
Adding Missing Values to a dataframe
Here is how we can add missing values to a dataframe using Pandas mask method together with NumPy’s random.random:
df_null = df.mask(np.random.random(df.shape) < .1)Code language: Python (python)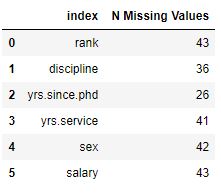
In the code chunk above, we are first creating a new dataframe called df_null. The dataframe is created by randomly setting 10% of the values in the original dataframe df to NaN values. This is accomplished using the mask() method, which randomly replaces values in df with NaN based on whether the corresponding value in a randomly generated array of the same shape is less than 0.1.
Counting Missing Values By Group in Pandas using the sum() Method
Here is how we can count the number of missing values by group in Pandas dataframe:
df_null.isnull().sum().reset_index(name='N Missing Values')Code language: Python (python)In the code chunk above, we call the isnull() method on df_null to generate a new data frame with the same shape as df_null, where the values are True where the corresponding value in df_null is NaN, and False otherwise.
Finally, we use the sum() method on the resulting dataframe to calculate the number of missing values in each column and then call the reset_index() method to convert the resulting Series into a dataframe. This dataframe will have the columns ‘index’ and ‘N Missing Values’. The ‘index’ column contains the names of the columns in df_null, and the ‘N Missing Values’ column contains the number of missing values in each column.
That said, let’s return to the example; if we run the same code as above (counting unique values by group), we can see that it will not count missing values:
df_null.groupby('rank').nunique()Code language: Python (python)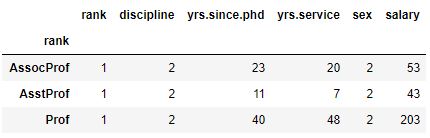
In the code chunk above, we use the groupby method to group the data by the ‘rank’ column. This creates a new object that is a groupby object with each group representing a unique value in the ‘rank’ column.
Next, we use the nunique() method to get a dataframe with the count of unique values for each column of the original dataframe in each group. This method is used to identify the number of unique values in each column for each group. As you may already know, this can provide insight into the distribution of values within each group.
We do not get the same numbers in the two tables because of the missing values. In the following examples, we will work with Pandas groupby to calculate the mean, median, and standard deviation by one group.
Pandas Groupby Mean
If we want to calculate the mean salary grouped by one column (rank, in this case) it’s simple. We use Pandas mean method on the grouped dataframe:
df_rank['salary'].mean().reset_index()Code language: Python (python)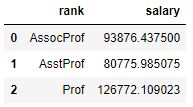
In the code chunk above, we used the groupby method to group the data by the ‘rank’ column. Now, In the example code, we want to calculate the mean salary for each group in the dataframe. To do this, we used the mean() method on the ‘salary’ column. This calculates the mean value of the ‘salary’ column for each group in the df_rank DataFrame.
Finally, we use the reset_index() method to convert the resulting Series into a dataframe with columns ‘rank’ and ‘salary’, where ‘rank’ contains the unique values in the ‘rank’ column, and ‘salary’ contains the mean salary for each group.
Having a column named salary may not be useful. For instance, if someone else is going to see the table they may not know that it’s the mean salary for each group. Luckily, we can add the rename method to the above code to rename the columns of the grouped data:
df_rank['salary'].mean().reset_index().rename(
    columns={'rank':'Rank','salary' : 'Mean Salary'})Code language: Python (python)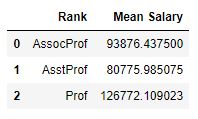
In the code chunk above, we added the rename() method to rename the columns of the dataframe. Note the rename() method takes a dictionary as an argument, where the keys are the original column names and the values are the new column names we want to assign to them.
Note, sometimes we may want to rename columns by removing special characters or whitespaces, for instance. In a more recent post, we learn how to rename columns in Pandas dataframes using regular expressions or by the superb Python package Pyjanitor: the easiest data cleaning method using Python & Pandas.
Median Score of a Group Using the groupby Method in Pandas
Now let’s group by discipline of the academic and find the median salary in the following example.
df.groupby('rank')['salary'].median().reset_index().rename(
    columns={'rank':'Rank','salary' : 'MedianSalary'})Code language: Python (python)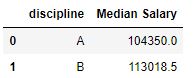
Aggregate Data by Group using the groupby method
Most of the time we want to have our summary statistics on the same table. We can calculate the mean and median salary, by groups, using the agg method. In the following Pandas groupby example, we are also adding the minimum and maximum salary by group (rank):
df_rank['salary'].agg(['mean', 'median',
                                  'std', 'min', 'max']).reset_index()Code language: Python (python)
In the previous code example, we used the agg() function to aggregate multiple statistics for the ‘salary’ column of a groupby object. First, we start selected the ‘salary’ column from the df_rank dataframe. After that, we used the agg() method on it. The agg() method takes a list of statistical measures we want to calculate. In the code above, we used the mean, median, standard deviation, minimum, and maximum values.
Moreover, the agg() method returns a dataframe with columns for each of the selected statistical measures, and each row corresponds to a unique value in the ‘rank’ column. So we get the statistical measures for each group in the ‘rank’ column. Here is the result:
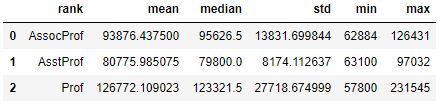
Finally, we call the reset_index() function to convert the resulting dataframe into a format where the ‘rank’ column is no longer the index, but a regular column.
Group by One Column, using the agg() Method and a Custom Function
An elegant thing with Pandas agg() method is that we can write custom functions and pass them ass arguments. Let’s say that we wanted, instead of having one column for min salary and one column for max salary, to have a column with the salary range:
def salary_range(df):
    mini = df.min()
    maxi = df.max()
    rang = '%s - %s' % (mini, maxi)

    return rang

df_descriptive = df_rank['salary'].agg(['mean', 'median', 'std', salary_range]).reset_index()Code language: Python (python)
Here, however, the output will have the name of the methods/functions used. That is, we will have a column named ‘salary_range’ and we are going to rename this column:
# Renaming Pandas Dataframe Columns
df_descriptive.rename(columns={'rank':'Rank', 'mean':'Mean', 'median':'Median',
                               'std':'Standard Deviation', 'salary_range':'Range'})Code language: Python (python)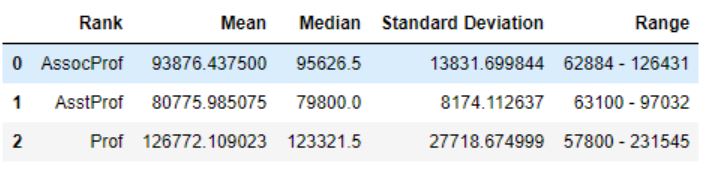
Grouping Data, using the agg() Method with SciPy
Furthermore, it’s possible to use methods from other Python packages, such as SciPy and NumPy. For instance, if we wanted to calculate the harmonic and geometric mean, we can use SciPy:
from scipy.stats.mstats import gmean, hmean

df_descriptive = df_rank['salary'].agg(['mean', 'median', hmean, gmean]).reset_index()
df_descriptiveCode language: Python (python)
In the code chunk above, we import the gmean and hmean functions from the scipy.stats.mstats module.
Next, we create a new dataframe called df_descriptive by calling the agg() function on the ‘salary’ column of the df_rank dataframe. We specify the statistical measures that we want to calculate as the input to the agg() method . In this case, we calculate the mean, median, harmonic mean, and geometric mean of each rank group’s ‘salary’ column.
After using the agg() method, we reset the index of the resulting datafame using the reset_index() function. This function converts the index of the DataFrame into a regular column and sorts the DataFrame in ascending order of ‘rank’.
The hmean and gmean methods that we imported at the beginning of the code are used to calculate the harmonic mean and geometric mean, respectively. These are less commonly used statistical measures useful in certain situations. The harmonic mean is often used to calculate an average rate or speed, while the geometric mean is often used to calculate an average growth rate.
More about doing descriptive statistics using Python:
- Descriptive Statistics using Python and Pandas
- How to do Descriptive Statistics in Python using Numpy
The next section will explore how to use pandas groupby to work with multiple columns/variables in our data.
Pandas Groupby Multiple Columns
In this section, we will continue with an example of grouping by many columns. In the first Pandas groupby example, we will group by two columns, and then we will continue grouping by two columns, ‘discipline’ and ‘rank’. To use Pandas groupby with multiple columns, we add a list containing the column names. In the example below, we also count the number of observations in each group:
df_grp = df.groupby(['rank', 'discipline'])
df_grp.size().reset_index(name='count')Code language: Python (python)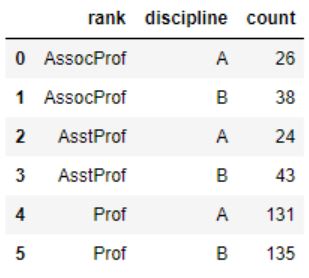
Again, we can use the get_group method to select groups. However, in this case, we have to input a tuple and select two groups:
# Get two groups
df_grp.get_group(('AssocProf', 'A')).head()Code language: Python (python)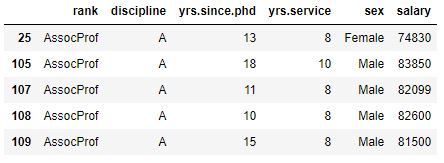
Pandas Groupby Count Multiple Groups
In the next groupby example, we will calculate the number of observations in three groups (i.e., “n”). We have to start by grouping by “rank”, “discipline” and “sex” using groupby. As with the previous example (groupby one column), we use the method size to calculate the n and reset_index, with the parameter name=”n”, to get the series to a dataframe:
# Pandas group by multiple (i.e., 3) columns:
df_3grps = df.groupby(['rank', 'discipline', 'sex'])
df_n_per_group = df_3grps.size().reset_index(name='n')Code language: Python (python)
Pandas groupby percentage
Now we can continue calculating the percentage of men and women in each rank and discipline. In this and the following example, we will use the apply method together with the lambda function.
perc = df.groupby(['rank', 'discipline', 'sex'])['salary'].size()

# Give the percentage on the level of Rank:
percbyrank = perc.groupby(level=0).apply(lambda x: 100 * x / float(x.sum()))

print(percbyrank)
print('Total percentage in group AssocProf. ',
      percbyrank.reset_index().query('rank == "AssocProf"')['salary'].sum())Code language: Python (python)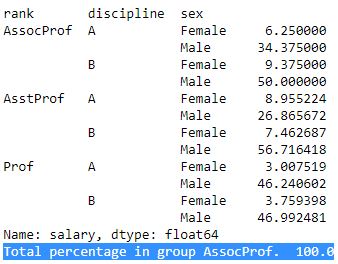
In the code chunk above, we start by grouping the data by three columns (i.e, ‘rank’, ‘discipline’, and ‘sex’). Next, we calculate the size of each resulting group by counting the number of entries in the ‘salary’ column.
Next, we calculate the percentage of each group within each rank. To do this, we group the results of the previous grouping operation by the ‘rank’ column using the groupby() method again and then apply a lambda function to calculate the percentage of each group within the rank. The apply() method applies the lambda method to each group, storing the resulting percentages in the percbyrank variable.
Finally, we print out the resulting percentages using the print() method , and also calculate the total percentage of the ‘AssocProf’ rank by querying the percbyrank dataframe using the reset_index() function to convert the index into columns, and the query() function selects only the rows where the ‘rank’ column is equal to ‘AssocProf’. We then use the sum() function to calculate the total percentage of ‘AssocProf’ across all disciplines.
We will continue by calculating the percentage of men and women in each group (i.e., rank and discipline). In the next groupby example, we summarize the total n (n=397). We can, for instance, see that there are more male professors regardless of discipline.
n = perc.reset_index()['salary'].sum()
totalperc =  perc.groupby(level=0).apply(lambda x:100*x/n).reset_index(name='% of total n')
totalperc.reset_index()Code language: Python (python)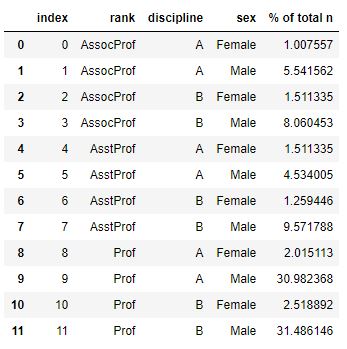
df_rn = df.groupby(['rank', 'discipline']).mean()Code language: Python (python)Furthermore, if we use the index method, we can see that it is MultiIndex:
df_rn.indexCode language: Python (python)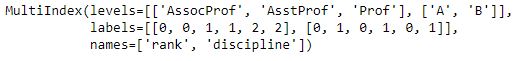
It’s easy to convert the Pandas groupby to dataframe; we have actually already done it. In this example, however, we will calculate the mean values per the three groups. Furthermore, we will add a suffix to each column and use reset_index to get a dataframe.
df_rn = df_rn.add_suffix('_Mean').reset_index()
type(df_rn)

# Output: pandas.core.frame.DataFrameCode language: Python (python)
Using groupby agg() Method with Multiple Groups
In this last section, we are going to use the agg method again, but this time we will use it together with multiple groups. However, we are not going into detail on how to use mean, median, and other methods to get summary statistics. This is because it’s the same as for grouping by n groups, and it’s better to get all the summary statistics in one table.
That is, we will calculate mean, median, and standard deviation using the agg method. In this groupby example, we are also adding the summary statistics (i.e., “mean”, “median”, and “std”) to each column. Otherwise, we will get a multi-level indexed result like the image below:
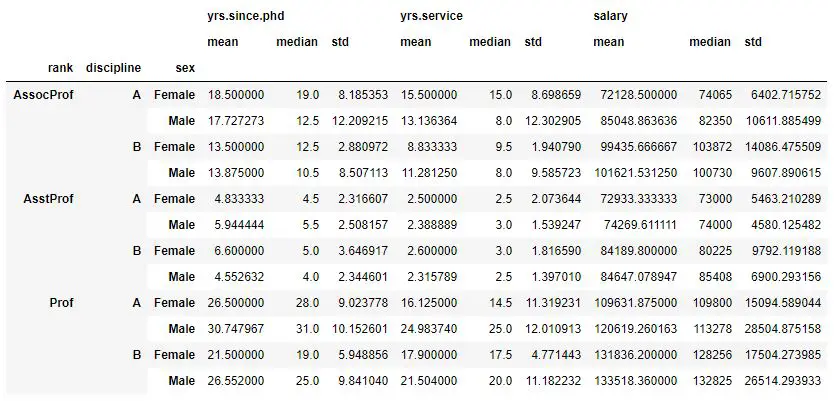
Group by Three Columns and Calculate Descriptive Stats
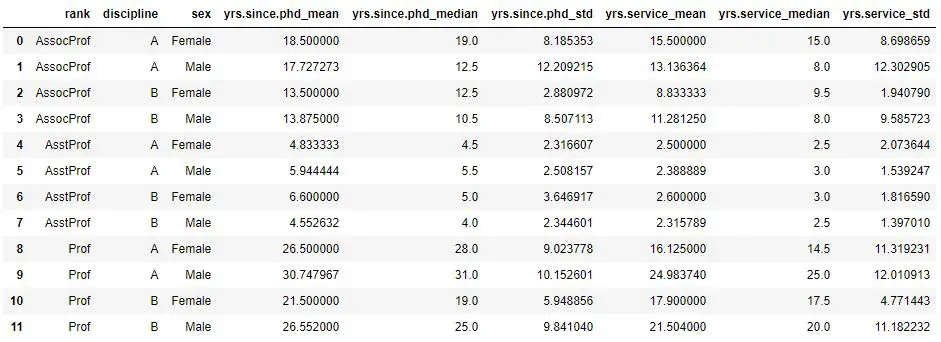
If we use Pandas columns and the method ravel together with list comprehension, we can add the suffixes to our column name and get another table. Note that we only print the first six columns in the example code below. In fact, with many columns, it may be better to keep the result multi-level indexed.
df_stats = df.groupby(['rank', 'discipline', 'sex']).agg(['mean', 'median', 'std'])
df_stats.columns = ["_".join(x) for x in df_stats.columns.ravel()]

df_stats.iloc[:,0:6].reset_index()Code language: Python (python)
In the code chunk above, we used df.iloc in the last line. What we did was take the first six columns using iloc. After that, we reset the index and thus got eight columns in total (see image below). If you need to learn more about slicing Pandas dataframes see the post in which you will learn how to use iloc and loc for indexing and slicing Pandas Dataframes.
Note, if we wanted an output as the first image we remove the second line above (“df_stats.columns = …”). As previously mentioned, we can also use custom functions, NumPy and SciPy methods when working with groupby agg. Just scroll back up and look at those examples, for grouping by one column, and apply them to the data grouped by multiple columns. More information about the different methods and objects used here can be found in the Pandas documentation.
Saving the Grouped Dataframe
In the last section of this Pandas groupby tutorial, we will learn how to write the grouped data to CSV and Excel files. We are going to work with Pandas to_csv and to_excel, to save the groupby object as CSV and Excel file, respectively. Note, we also need to use the reset_index method, before writing the dataframe.
Now, before saving the groupby object, we start by importing a data file from CSV. Here, we use the same example as above. That is, we load the salaries data, group the data by rank, discipline, and sex. When this is done, we calculate the percentage by rank (i.e., by group).
import pandas as pd

data_url = 'http://vincentarelbundock.github.io/Rdatasets/csv/carData/Salaries.csv'
df = pd.read_csv(data_url, index_col=0)


perc = df.groupby(['rank', 'discipline', 'sex'])['salary'].size()

percbyrank = perc.groupby(level=0).apply(lambda x: 100 * x / float(x.sum())Code language: Python (python)
Saving Groupby as CSV
In this subsection, we will save the Pandas groupby object as a CSV file. Note, first we reset the index and we use the argument index and set it to False as we don’t want a column with the indexes in the resulting CSV file.
df.reset_index()
df.to_csv('percentage_rank_per_disciplin.csv',
         index=False)Code language: Python (python)
Saving Groupby as an Excel File
In this subsection, we use the to_excel method to save the Pandas groupby object as a .xlsx file. Other than that, it’s the same as the example above where we used to_csv.
df.reset_index()
df.to_excel('percentage_rank_per_disciplin.xlsx',
         index=False)Code language: Python (python)
If you want a Jupyter notebook of the code used in this Pandas groupby tutorial, click here.
Conclusion:
In this Pandas groupby tutorial, we have learned how to use this method to:
- group one or many columns
- count observations using Pandas groupby count and size
- calculate simple summary statistics using:
- groupby mean, median, std
- groupby agg (aggregate)
- agg with custom method
- Calculate the percentage of observations in different groups